40% Off Signals

Welcome to the EdgeFinder Tour

Welcome to the EdgeFinder Tour — your go-to guide for exploring the tool’s features and learning how to use them in your trading. Whether you're new or already using the EdgeFinder, this page breaks down everything from sentiment and fundamentals to scoring systems—so you can see how it helps spot real trading opportunities.

Full video tutorial

Check out TraderNick’s full video tutorial, where he covers every feature step-by-step and shows how he uses the tool to find trade setups.
*Important note: For the best results, the EdgeFinder should be used alongside your own strategy, technical analysis, and risk management. It’s designed to help you make more informed decisions—not make them for you.

How to Trade with the EdgeFinder:

Step 1: Identify Opportunities
Start by visiting the Top Setups page, where the EdgeFinder highlights assets with the strongest bullish and bearish scores. These rankings are based on a combination of fundamental factors, helping you quickly spot potential trade setups.
top setups edgefinder
Step 2: Confirm with Your Analysis
Compare the EdgeFinder’s top-rated setups with your own technical analysis. Does an asset align with your trading strategy? Look for confluence between the EdgeFinder’s insights and your preferred indicators, chart patterns, or price action signals.

Step 3: Make an Informed Decision
Once you’ve found a setup that matches your analysis, consider refining your entry and exit points based on support, resistance, and risk management principles. Use the EdgeFinder’s in-depth data to strengthen your conviction before placing a trade.

Important things to Consider:

A strong bullish or bearish rating doesn’t mean a trade should be taken. The EdgeFinder is a tool to support your analysis, not replace it.

Strategy Alignment – Only trade setups that fit your strategy.
Technical Confirmation – Look for confluence with key levels and trends.
Market Conditions – Be aware of news events and volatility.
Risk Management – Always use stop losses and proper sizing.

There are times when a setup looks strong, but we choose not to trade because it doesn’t align with our approach. Use the EdgeFinder to enhance your decision-making, not dictate it.

About edgeFinder's features:

  • top setups edgefinder

    Top Setups

    The Top Setups Page on the EdgeFinder is designed as a daily watchlist tool for traders. The EdgeFinder's algorithm highlights which assets have the strongest bullish or bearish signals, based on a collection of fundamental, sentiment, and technical metrics.

    data scanners

    The EdgeFinder provides an in-depth score breakdown for each asset, consolidating key fundamental and sentiment-based metrics in one place. On an asset's score breakdown page you can view the currencies' COT data, retail sentiment, seasonality, trend reading, GDP growth, inflation, unemployment, and interest rates all in one place.

    COT data

    The Commitment of Traders (COT) data page on the EdgeFinder is a powerful tool that reveals the positioning of major financial players, such as institutions, in the market. 
  • Smart Money indicator

    The EdgeFinder's Smart Money Indicator is a powerful tool designed to compare institutional (smart money) and retail sentiment, highlighting divergences or convergences in their market interest. 

    retail sentiment

    The Retail Sentiment tab in the EdgeFinder offers valuable insights into retail trader positioning, which can help traders make more informed, contrarian decisions. The EdgeFinder aggregates data from various sources to show whether retail traders are long or short on key markets like forex, commodities, and indices.

    put-to-call 

    The Put/Call Ratio is one of the simplest yet most powerful sentiment indicators available—and it’s built right into the EdgeFinder. This tool helps gauge investor sentiment by comparing the number of bearish bets (puts) to bullish bets (calls) placed in the options market.
  • aAII investor sentiment

    The AAII Investor Sentiment survey provides traders with valuable insights into the overall market sentiment, enabling them to gauge the prevailing bullish or bearish bias among individual investors and make informed trading decisions.
    Seasonality monthly NZDUSD

    data scanners

    The Seasonality Score leverages historical data to highlight average monthly and weekly performance trends, helping traders make informed decisions based on recurring market behaviors. Seasonality in financial markets reflects the idea that certain assets often follow predictable patterns during specific times of the year.

    Economic Heatmap

    The Economic Heatmap and Economic Surprise Meters inside the EdgeFinder give traders a fast, visual way to interpret the strength or weakness of global economies. These tools analyze recent economic data against expectations—helping traders make smarter decisions in forex, commodities, indices, and even stocks.

EdgeFinder Video tutorials

EdgeFinder Ultimate Guide: Powerful Software for Fundamental, Sentiment, and Technical Analysis

How to Trade the COT Report like a PRO | Commitment of Traders Report

What is EdgeFinder? BEST Sentiment & Fundamental Analysis Trading Software

The Put-Call Ratio Explained: BEST Greed & Fear Sentiment Indicator

How to Find Profitable Trading Setups with EdgeFinder!

How to Trade with the AAII Investor Sentiment Survey Indicator

How to Trade with the Bitcoin to Gold Ratio: A Powerful Sentiment Indicator

How To Trade Using The Economic Surprise Meter

Real trade examples using EdgeFinder: 

September 9, 2025
Breaking Down My $17,000 Silver Trade

Here’s the full breakdown of my $17,000 silver trade—why I entered, how I managed it, and what’s driving silver.

Read More
July 10, 2025
Nick’s Big Win on Small Caps: What He Saw Before the Breakout

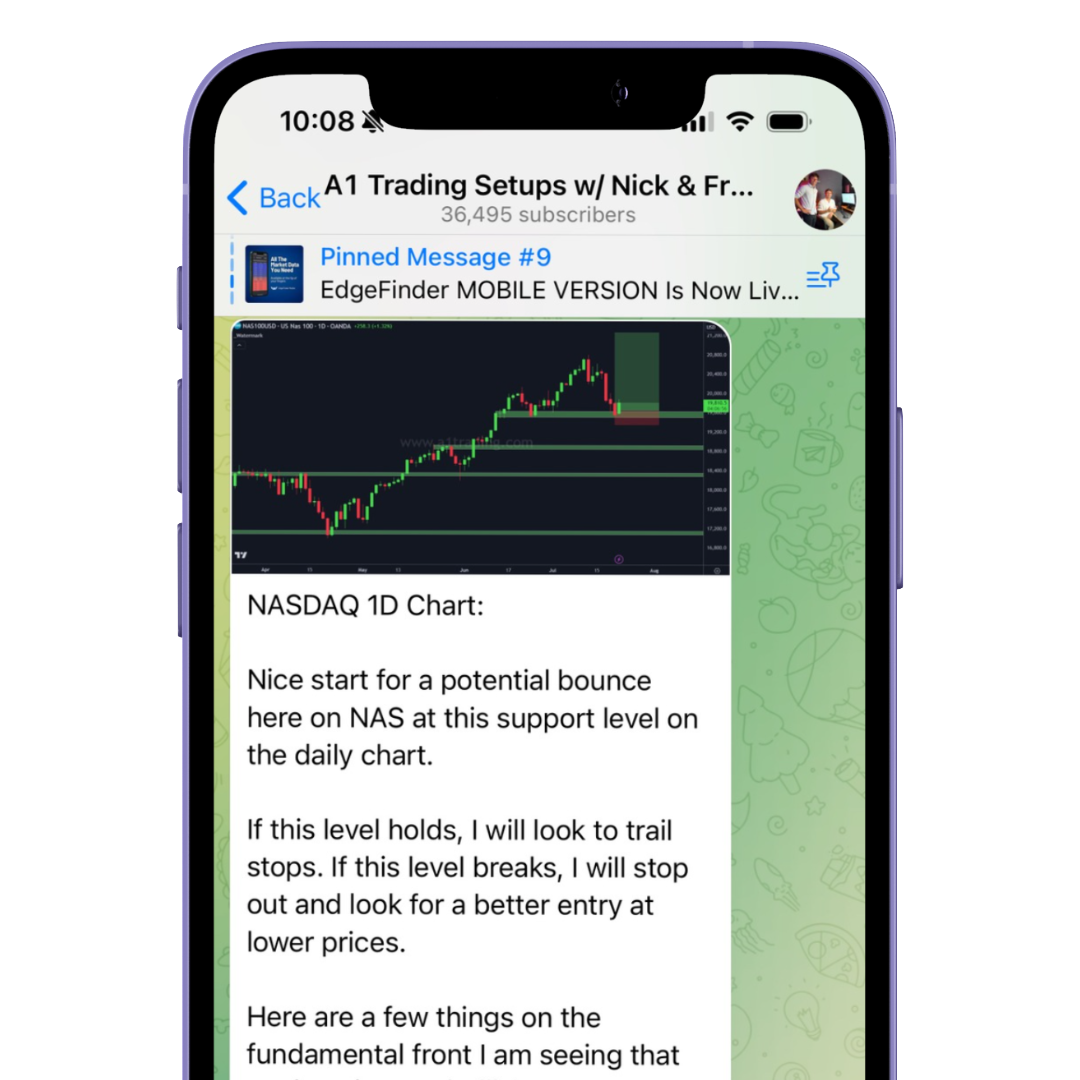
In one of his most successful trades of the year so far, Nick capitalized on a major breakout in the Russell 2000 (US2000) index, driven by a combination of macroeconomic shifts and well-timed entries. Let’s break down the trade, the reasoning behind it, and how Nick managed it with a professional trailing stop strategy. The […]

Read More
June 25, 2025
3 Forex Trades Nick Just Closed for Profit

Discover how Nick locked in three profitable forex trades this week—and the strategies behind each win.

Read More

Frequently asked questions (FAQs):

How much does the EdgeFinder Cost?

Is the EdgeFinder a one time payment?

Yes! The EdgeFinder is a one time payment. You will not be charged reoccurring fees once you purchase full access.

Is there a trial available for the EdgeFinder?

We do offer trials for the EdgeFinder! Our trials offer 30 days access to the tool for a non-refundable price of FREE. The FREE can be applied as credit towards your final purchase. To get your trial started, please fill out this form here. A member of our team will reach out to you shortly to get you started!

How accurate is the edgeFinder?

Because the EdgeFinder is not a signal service or a complete trading system, it’s not possible to assign a fixed “accuracy” to the biases it produces. The tool does not predict price action. Instead, it analyzes economic, sentiment, and price data to generate a directional bias based on how those factors have historically influenced the market.

That bias is simply one piece of the puzzle—it’s meant to support your own trading strategy, not replace it. It’s entirely possible for an asset to show a strong bullish or bearish score while price moves in the opposite direction due to technical breakouts, surprise news, or other market-moving events the EdgeFinder can’t account for.

is the edgefinder 100% accurate?

No, the EdgeFinder is not 100% accurate. There is no tool, trading strategy, or trader that is 100% accurate at predicting the way the market moves. We do not recommend blindly following any indicator or signal service. There is a significant degree of risk involved in trading.

What assets are included on the EdgeFinder?

AUDUSD, NZDUSD, USDZAR, GBPUSD, USDJPY, USDCAD, USDCHF, EURUSDAUDCAD, AUDCHF, AUDJPY, AUDNZD, CADCHF, CADJPY, CHFJPY, EURAUD, EURCAD, EURCHF, EURGBP, EURJPY, EURNZD, GBPAUD, GBPCAD, GBPCHF, GBPJPY, GBPNZD, NZDCAD, NZDCHF, NZDJPY, XAUUSD, PLATINUM, SILVER, COPPER, USOIL, GER30, US30, SPX500, US10Y, NAS100, JP225, UK100, RUSSELL, US10Y

What time frames can you use the EdgeFinder on?

The EdgeFinder gives directional bias and is not time based. Therefore, there is not a specific time frame that is best for the EdgeFinder.

is the edgeFinder good for Day traders/ Swing traders?

The EdgeFinder isn’t built around a specific trading timeframe—it doesn’t give entry or exit signals. Instead, it provides a calculated directional bias based on sentiment and economic data, which can be useful for both day traders and swing traders alike.

Rather than focusing on timing, the EdgeFinder helps traders identify potential trade ideas by highlighting favorable market conditions. That bias can then be paired with your own strategy or technical setups to decide when (or whether) to enter a trade.

is the edgefinder in realtime?

While the EdgeFinder is not necessarily realtime, it is fully automatic in its data collection. The EdgeFinder uses a variety of data sources and inputs. Most price data updates are on a 15 minute timer, while economic data updates every few hours. COT data updates weekly (as it only releases 1 time per week), and retail sentiment updates every 30 minutes.

Find your trading edge

Take the guesswork out of trading with the EdgeFinder.
View Discounts>>

access now

Free Telegram

Join free telegram for analysis, trade ideas, & trading resources!

Join telegram

Home
Edgefinder
StockBox
Signals

LINDEX Company

LINDEX is a leading financial analysis and trading education company dedicated to empowering traders of all levels. Our team combines extensive market knowledge with cutting-edge technology to provide valuable insights and tools for traders worldwide.
2025 All Rights Reserved | LINDEX Company
Leveraged trading in foreign currency contracts or other off-exchange products on margin carries a high level of risk and is not suitable for everyone. You may lose more than you invest. Price and performance data is provided for informational purposes only and is not investment advice. Past performance is not indicative of future results.

There is a significant degree of risk involved in trading securities. With respect to foreign exchange trading, there is considerable risk exposure, including but not limited to, leverage, creditworthiness, limited regulatory protection and market volatility that may substantially affect the price, or liquidity of a currency or currency pair. CFDs are complex instruments and come with a high risk of losing money rapidly due to leverage. The vast majority of retail client accounts lose money when trading in CFDs. You should consider whether you can afford to take the high risk of losing your money.
homepencilsmartphonelaptop-phonechart-barscross-circle
linkedin facebook pinterest youtube rss twitter instagram facebook-blank rss-blank linkedin-blank pinterest youtube twitter instagram