40% Off Signals

How to Use the EdgeFinder's Top Setups

EdgeFinder Tutorials
The Top Setups Page on the EdgeFinder is designed as a daily watchlist tool for traders. The EdgeFinder's algorithm highlights which assets have the strongest bullish or bearish signals, based on a collection of fundamental, sentiment, and technical metrics.
EdgeFinder Top Setups Bullish bearish signals AI trading tool

How to use the top setups page:

Daily Watchlist

The Top Setups page presents a list of markets, such as currency pairs, commodities, indices, and metals, each with a bias score that reflects its potential for bullish or bearish momentum.
EdgeFInder Top Setups Score how to use the edgefinders top setups

Bias Score

The EdgeFinder algorithm calculates bias scores based on a combination of economic data, sentiment readings, and technical trends. Scores of +5 or above indicate a bullish outlook, while scores of -5 or below indicate a bearish outlook. This makes it easy to scan the list and find assets with strong momentum in either direction.

Trade Confirmation

After identifying an asset with a strong bias, traders often use their own strategies for final confirmation. For example, if the Dow Jones has a “very bullish” score, you might look for a bullish price pattern, such as a break and retest, to align with the EdgeFinder’s analysis before placing a trade.

Filtering Options

You can filter to focus on specific asset types (e.g., only major currency pairs or indices) or remove assets you don’t typically trade. This customizable filtering ensures that you only see relevant assets for your watchlist.
EdgeFInder Top Setups Filtering Options how to trade with the edgefinder

Understanding the Top Setups Views

The EdgeFinder’s Top Setups feature includes multiple views designed to help you analyze trade opportunities from different angles. Whether you're focused on fundamentals, sentiment, technicals, or a blend of all three, these views let you explore the data in a way that suits your strategy.
Simple
Eco Only
Sentiment Only
Score History
Trade Ideas
The “Top Setups – Simple” page offers a clean, no-frills overview of all available assets in the EdgeFinder. Traders can quickly scan the overall score, sentiment score, technical score, and economic (ECO) score for each asset—making it easy to identify potential opportunities at a glance.
Top Setups Simple
The “Top Setups – ECO Only” page displays each asset’s EdgeFinder score based solely on economic data—excluding sentiment and technical factors. It highlights key fundamentals such as GDP, PMI, retail sales, CPI, PPI, PCE, employment change, unemployment rate, and interest rates. This view is ideal for traders who want to focus strictly on the macroeconomic outlook.
Top Setups ECO
The “Top Setups – Sentiment Only” page shows each asset’s overall sentiment score, based entirely on sentiment-related data. This includes COT (Commitment of Traders) positioning, retail sentiment, the put-call ratio, and AAII sentiment. It’s a focused view designed for traders who want to gauge market positioning and crowd psychology without the influence of fundamentals or technicals.
Top Setups Sentiment Only
The “Top Setups – Score History” page allows traders to view how the EdgeFinder’s score for a selected asset has changed over time. Users can customize the date range to track score trends over days, weeks, or months. Alongside the score, the page also displays the asset’s daily closing price, offering helpful context for understanding how the EdgeFinder’s analysis aligned with market movement.
edgefinder top setups score history
The “Trade Ideas” page presents visualizations of potential trade setups derived from the EdgeFinder’s Top Setups scores. For each asset, the chart highlights an entry zone, target, and a possible stop loss level, based on a blend of fundamental, sentiment, and technical data.

Traders can see:
- Entry-Min and Entry-Max levels
- Target level
- Possible stop loss level
- Trend + / Trend - lines
- Closing price over time
This information is for informational purposes only and should not be considered financial advice.
EdgeFinder trade ideas top setups
hello world!

Video Tutorials

How to use the top setups page
See How Nick uses the Top setups page to find new positions!

Frequently asked questions

How is the Total score calculated?

The Top Setups page showcases the total calculated scores of all metrics considered by the EdgeFinder, for each symbol that it tracks. The "Score" tab is the finalized sum of all columns/scored metrics.

The EdgeFinder's bias on a symbol is "Bullish" if the total score is greater or equal to +5, and "Very Bullish" if the total score is greater or equal to +9.

The EdgeFinder's bias on a symbol is "Bearish" if the total score is less than or equal to -5, and "Very Bearish" if the total score is less than or equal to -9.

How Accurate Is the EdgeFinder?

Because the EdgeFinder is not a signal service or a complete trading system, it’s not possible to assign a fixed “accuracy” to the biases it produces. The tool does not predict price action. Instead, it analyzes economic, sentiment, and price data to generate a directional bias based on how those factors have historically influenced the market.

That bias is simply one piece of the puzzle—it’s meant to support your own trading strategy, not replace it. It’s entirely possible for an asset to show a strong bullish or bearish score while price moves in the opposite direction due to technical breakouts, surprise news, or other market-moving events the EdgeFinder can’t account for.

That said, many traders (including our own team) have found that using the EdgeFinder alongside their technical setups helps them spot better opportunities and make more informed decisions. View their track record here.

What assets does EdgeFinder monitor?

Indices:
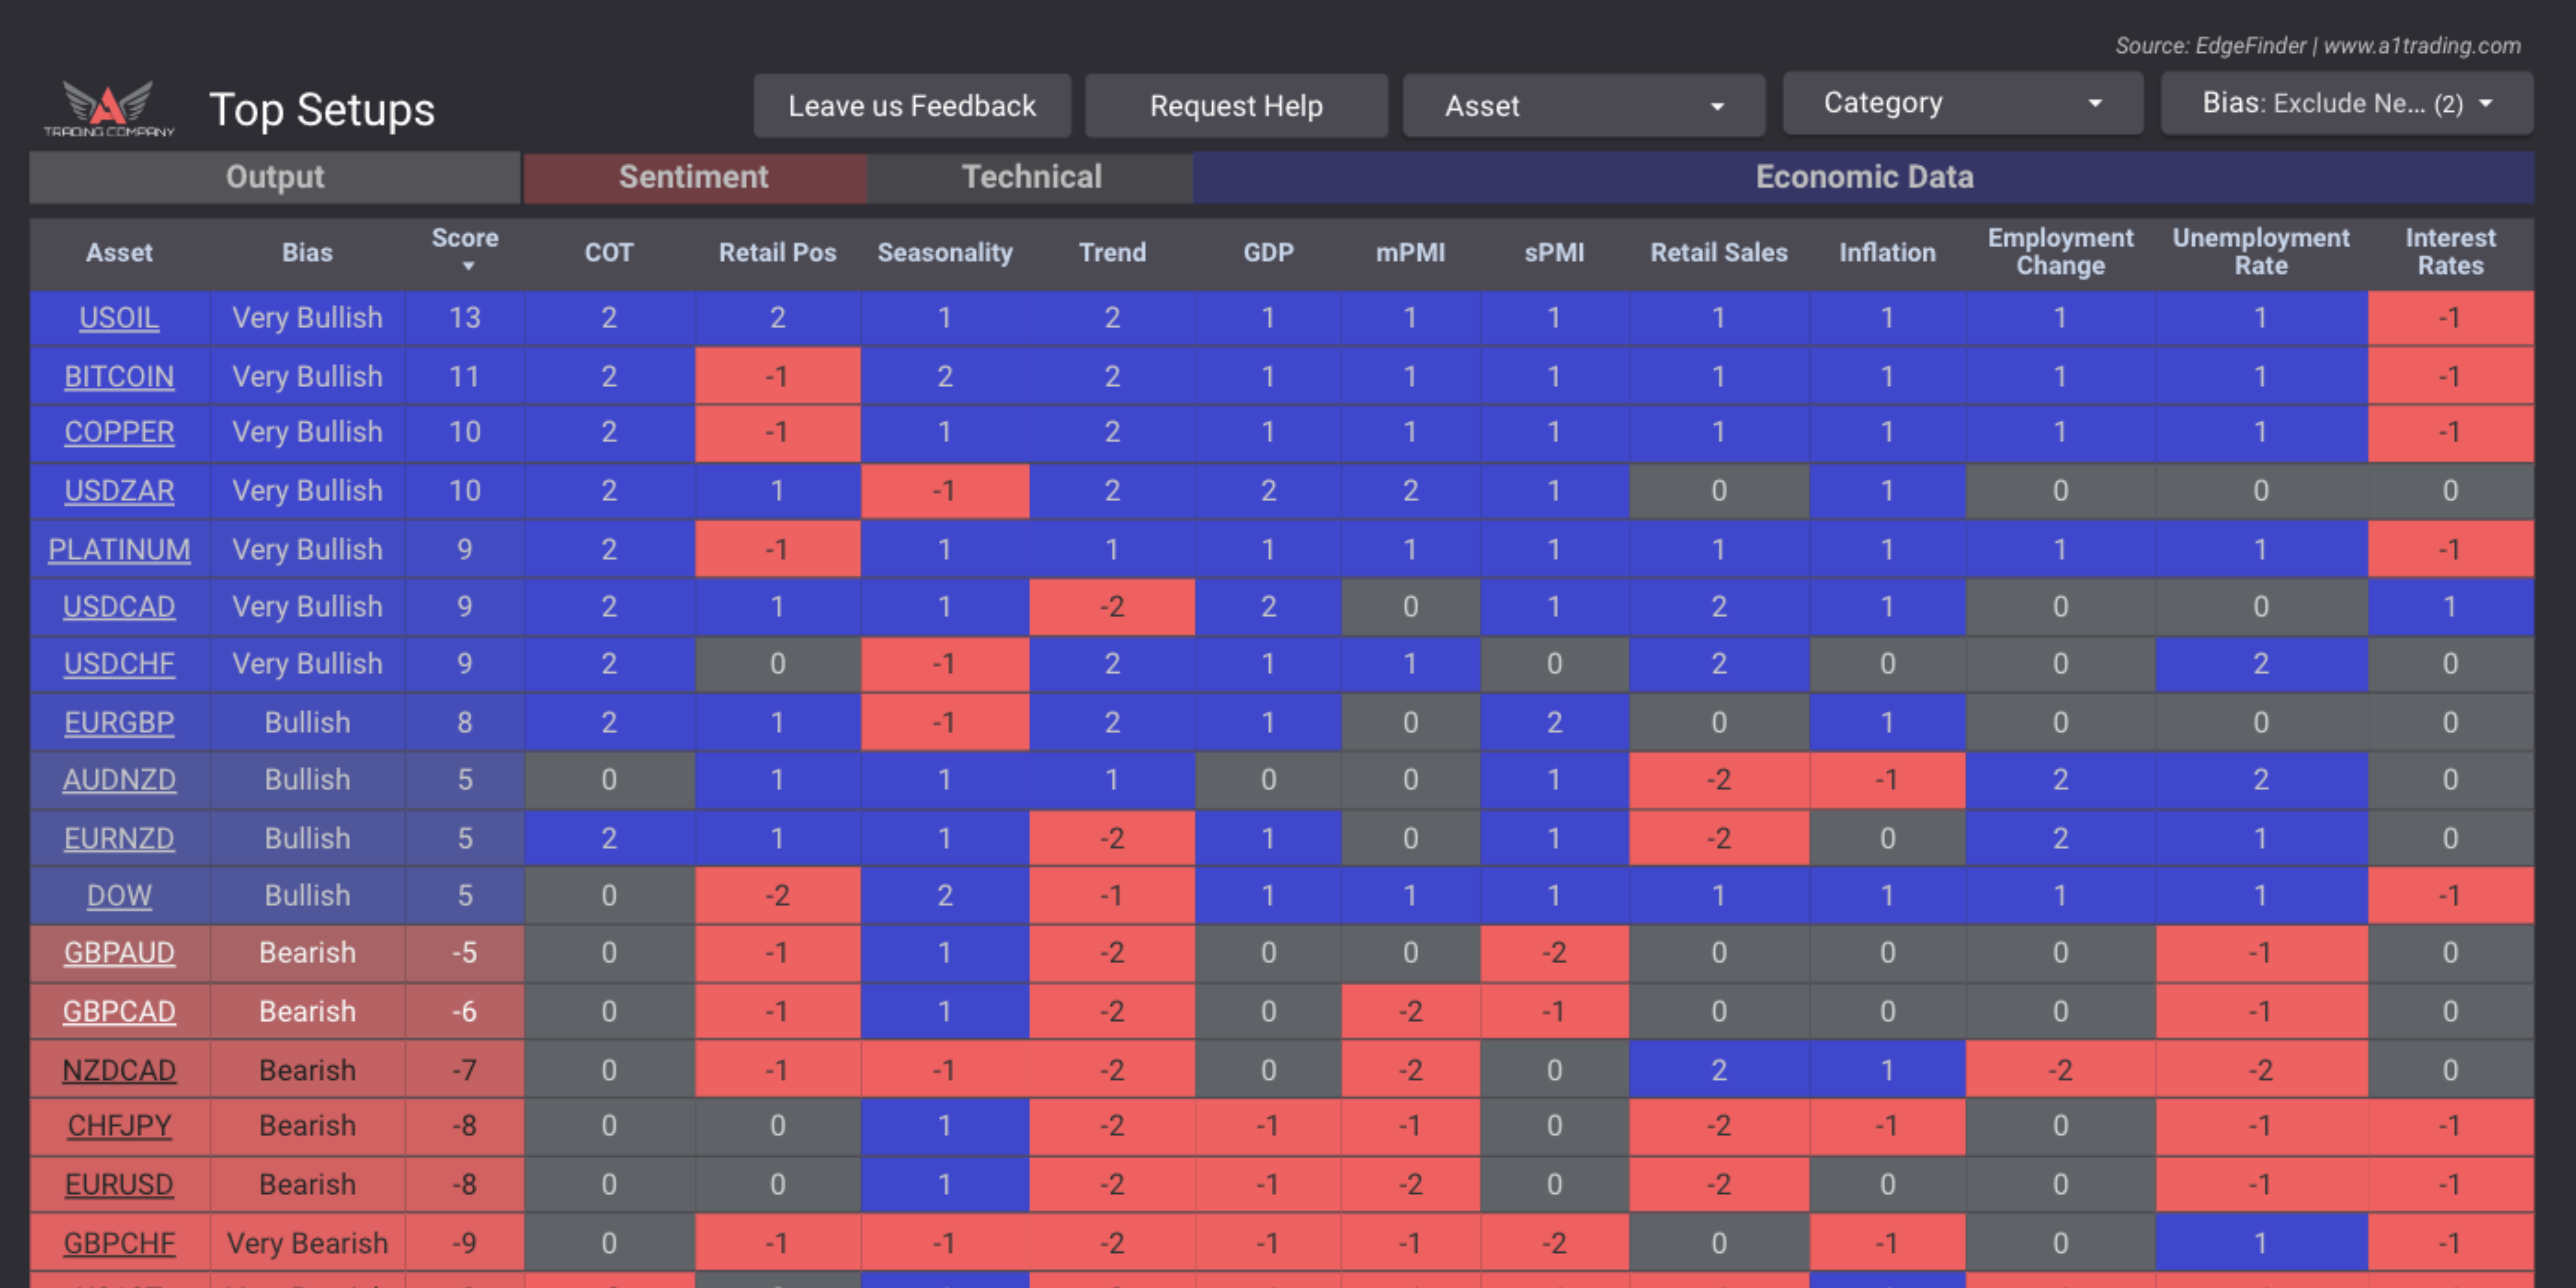
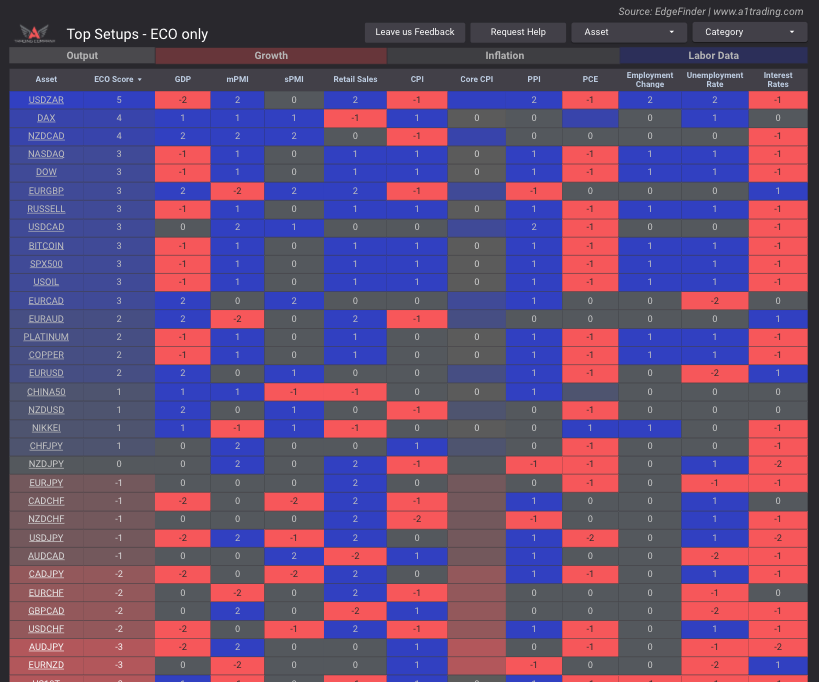
S&P500, Dow Jones, Nasdaq, DAX, Nikkei, FTSE100

Metals:
GOLD, SILVER, PLATINUM, COPPER

Forex Major Pairs:
AUDUSD, NZDUSD, USDZAR, GBPUSD, USDJPY, USDCAD, USDCHF, EURUSD

Forex Minor Pairs:
AUDCAD, AUDCHF, AUDJPY, AUDNZD, CADCHF, CADJPY, CHFJPY, EURAUD, EURCAD, EURCHF, EURGBP, EURJPY, EURNZD, GBPAUD, GBPCAD, GBPCHF, GBPJPY, GBPNZD, NZDCAD, NZDCHF, NZDJPY

Energy:
USOIL

Bonds:
US Treasuries

Find your trading edge

Take the guesswork out of trading with the EdgeFinder.
View Discounts>>

access now

Take a full tour!

Check out our EdgeFinder tour page to take a deep dive into all its unique features!

Go to tour

Home
Edgefinder
StockBox
Signals

LINDEX Company

LINDEX is a leading financial analysis and trading education company dedicated to empowering traders of all levels. Our team combines extensive market knowledge with cutting-edge technology to provide valuable insights and tools for traders worldwide.
2025 All Rights Reserved | LINDEX Company
Leveraged trading in foreign currency contracts or other off-exchange products on margin carries a high level of risk and is not suitable for everyone. You may lose more than you invest. Price and performance data is provided for informational purposes only and is not investment advice. Past performance is not indicative of future results.

There is a significant degree of risk involved in trading securities. With respect to foreign exchange trading, there is considerable risk exposure, including but not limited to, leverage, creditworthiness, limited regulatory protection and market volatility that may substantially affect the price, or liquidity of a currency or currency pair. CFDs are complex instruments and come with a high risk of losing money rapidly due to leverage. The vast majority of retail client accounts lose money when trading in CFDs. You should consider whether you can afford to take the high risk of losing your money.
homesmartphonelaptop-phonechart-barscross-circle
linkedin facebook pinterest youtube rss twitter instagram facebook-blank rss-blank linkedin-blank pinterest youtube twitter instagram