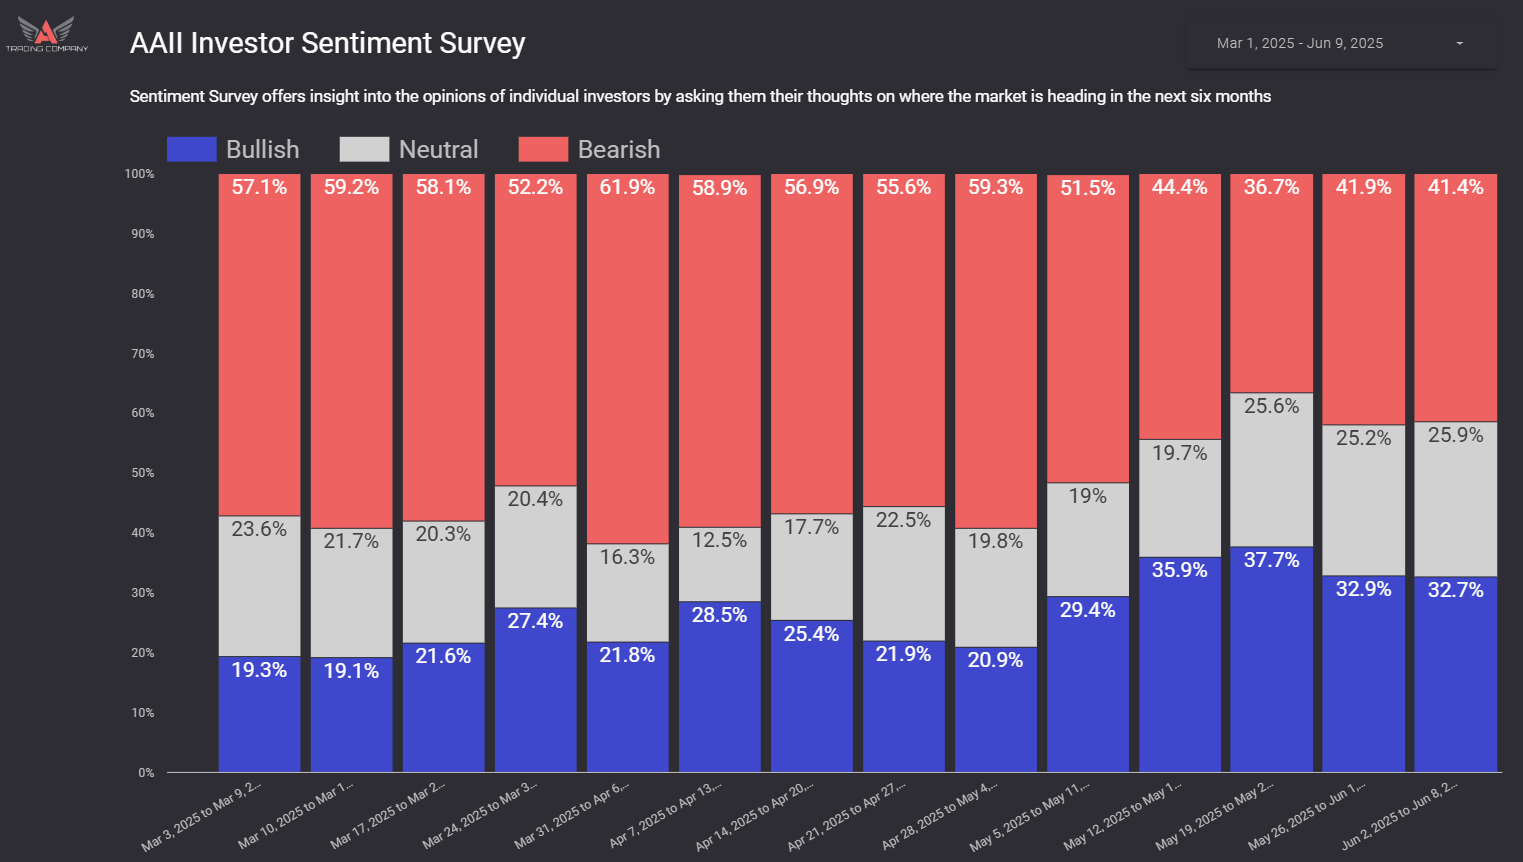
Within each vertical bar, there are three segments. In order of stacking from the bottom, the values read as bullish, neutral and bearish. The yellow line crossing through the bar chart is the bull-to-bear spread. A positive spread means that the overall sentiment is leaning bullish. And a negative spread indicates bearishness in overall sentiment.
Extreme Bullish Sentiment: High optimism can indicate overextension, signaling a potential pullback.
Extreme Bearish Sentiment: High fear often aligns with market bottoms, suggesting a potential reversal.