40% Off Signals

How to Use the EdgeFinder's Economic Heatmap & Surprise Meter

The Economic Heatmap and Economic Surprise Meters inside the EdgeFinder give traders a fast, visual way to interpret the strength or weakness of global economies. These tools analyze recent economic data against expectations—helping traders make smarter decisions in forex, commodities, indices, and even stocks.
US Economic Heatmap on the EdgeFinder
Economic Heatmap Overview
The Economic Heatmap provides a country-specific snapshot of recent high-impact economic data releases. It compares actual results to forecasts and shows how significantly those results deviated from expectations.

Key Features:
Change Column: Shows the numerical difference between the forecast and actual data.
Color Coding:
Blue = Positive surprise → Risk-on sentiment (typically bullish for stocks, crypto, etc.)

Red = Negative surprise → Risk-off sentiment (bullish for safe-haven assets like gold or bonds)

Yellow Dates: Highlight data released within the last 7 days.
Covered Economies:
United States (US)
European Union (EU)
United Kingdom (UK)
Japan (JP)
Canada (CA)
Australia (AU)
New Zealand (NZ)
Switzerland (CH)
China (CN)
What Is the Economic Surprise Meter?
Eco surprise meter
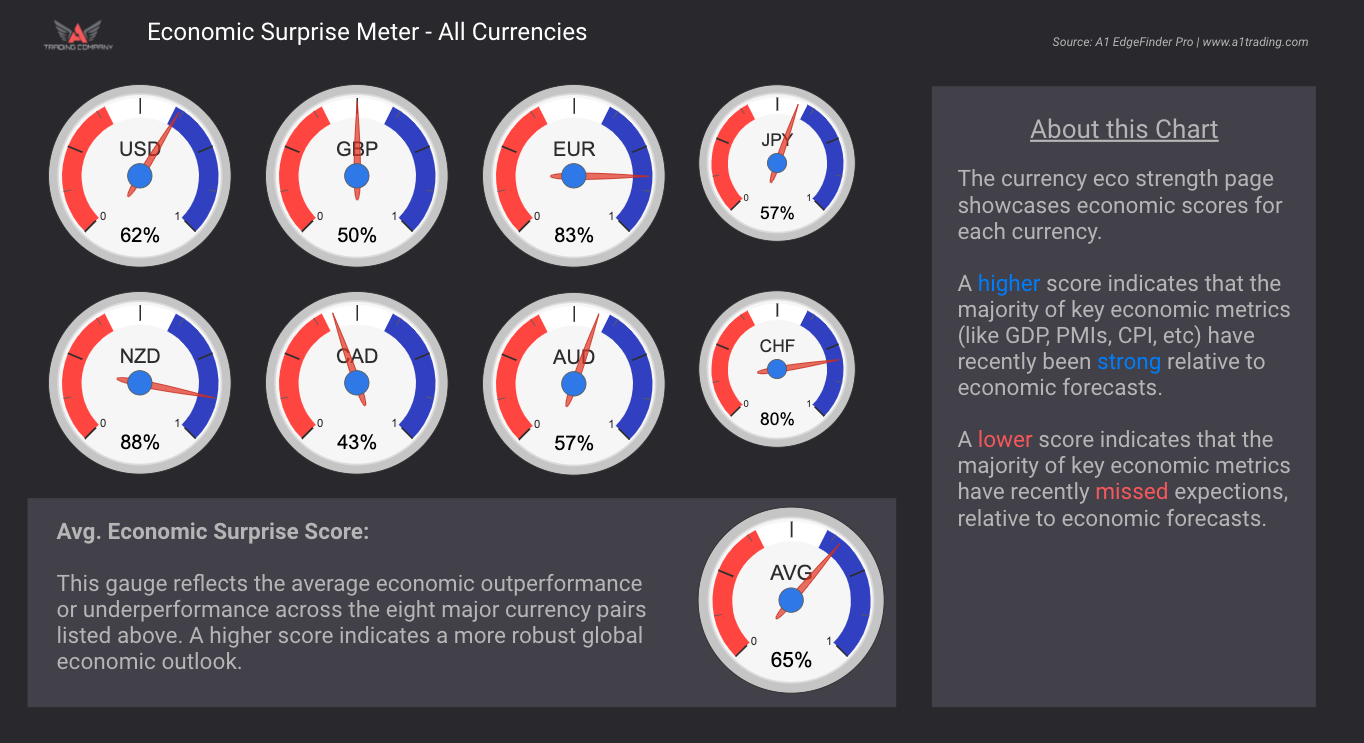
The Economic Surprise Meter builds on the heatmap by converting all those data surprises into scored gauges—one for each of the 8 major currencies:

USD, EUR, GBP, JPY, CHF, AUD, CAD, NZD

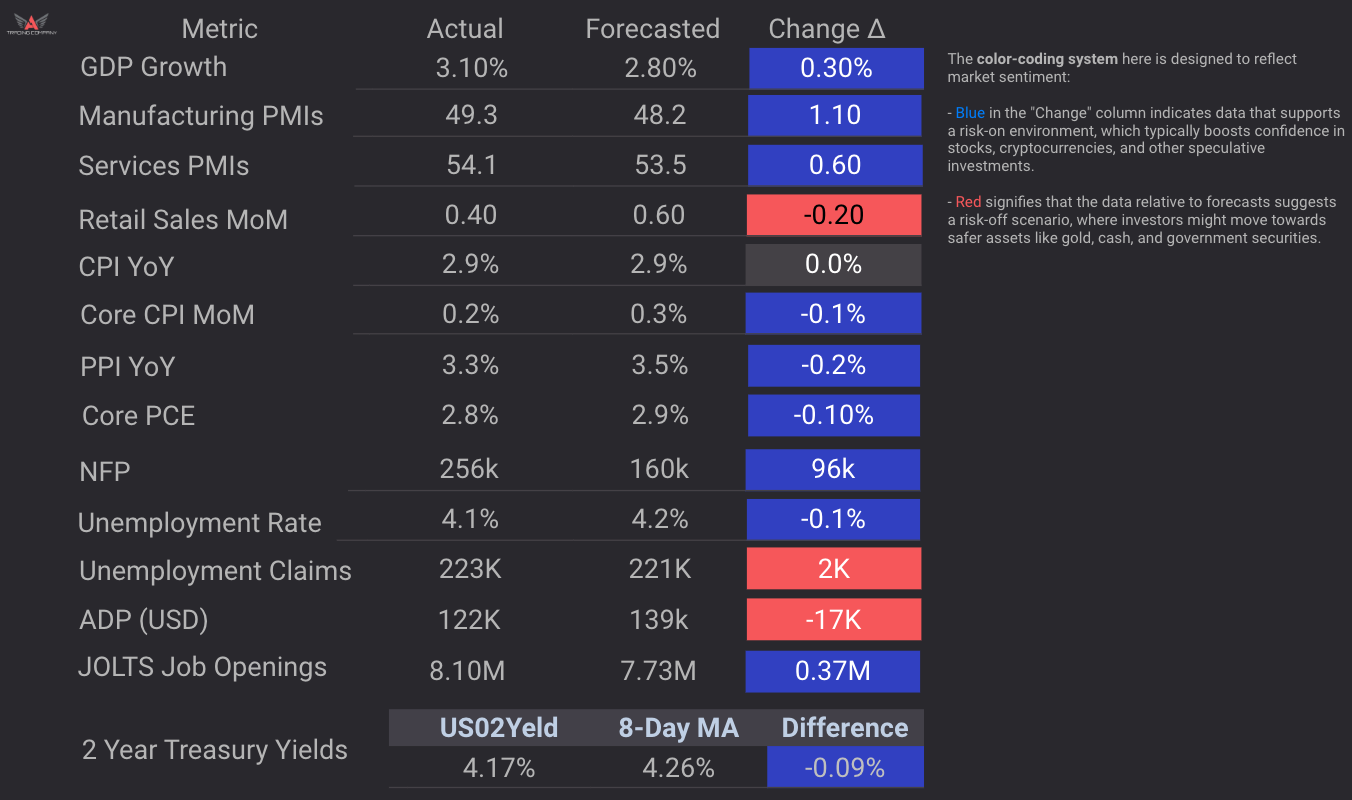
Each gauge shows a 0–100 score based on how well recent economic data is performing relative to expectations. It’s not just about whether GDP, inflation, or jobs data improved—but whether it beat or missed forecasts.
Interpreting the Scores:
High Score: The country’s recent economic data has mostly exceeded forecasts → Bullish for that currency.

Low Score: The data has largely missed expectations → Bearish for that currency.

This is especially useful for identifying potential fundamental strength or weakness in a currency—even if price action hasn't caught up yet.

Stock Surprise Meter (For Equities & Indices Traders)
In addition to the currency view, the Stock Surprise Meter shows how the same economic data impacts stock markets in each country.

This matters because the same data can impact currencies and stocks differently:

Example: Cooling inflation is bearish for currencies (due to lower rate hike expectations) but bullish for stocks (lower rates = higher valuations).
Each stock market gets its own score based on how current data would be expected to affect equity performance. This allows traders to adjust their bias on stock indices like the S&P 500, DAX, FTSE, or Nikkei based on the strength or weakness of the underlying economy.

You’ll also find an average score across global stock markets to get a sense of overall equity sentiment.

Video Tutorials

How to Trade with Fundamentals: Macro Economic Cycles 101
How to Trade Economic Data Releases like a PRO
How To Trade Using The Economic Surprise Meter

Find your trading edge

Take the guesswork out of trading with the EdgeFinder.
View Discounts>>

access now

Take a full tour!

Check out our EdgeFinder tour page to take a deep dive into all its unique features!

Go to tour

Home
Edgefinder
StockBox
Signals

LINDEX Company

LINDEX is a leading financial analysis and trading education company dedicated to empowering traders of all levels. Our team combines extensive market knowledge with cutting-edge technology to provide valuable insights and tools for traders worldwide.
2025 All Rights Reserved | LINDEX Company
Leveraged trading in foreign currency contracts or other off-exchange products on margin carries a high level of risk and is not suitable for everyone. You may lose more than you invest. Price and performance data is provided for informational purposes only and is not investment advice. Past performance is not indicative of future results.

There is a significant degree of risk involved in trading securities. With respect to foreign exchange trading, there is considerable risk exposure, including but not limited to, leverage, creditworthiness, limited regulatory protection and market volatility that may substantially affect the price, or liquidity of a currency or currency pair. CFDs are complex instruments and come with a high risk of losing money rapidly due to leverage. The vast majority of retail client accounts lose money when trading in CFDs. You should consider whether you can afford to take the high risk of losing your money.
homesmartphonelaptop-phonechart-barscross-circle
linkedin facebook pinterest youtube rss twitter instagram facebook-blank rss-blank linkedin-blank pinterest youtube twitter instagram