40% Off Signals

How to use the EdgeFinder's seasonality data

edgeFinder Tutorials
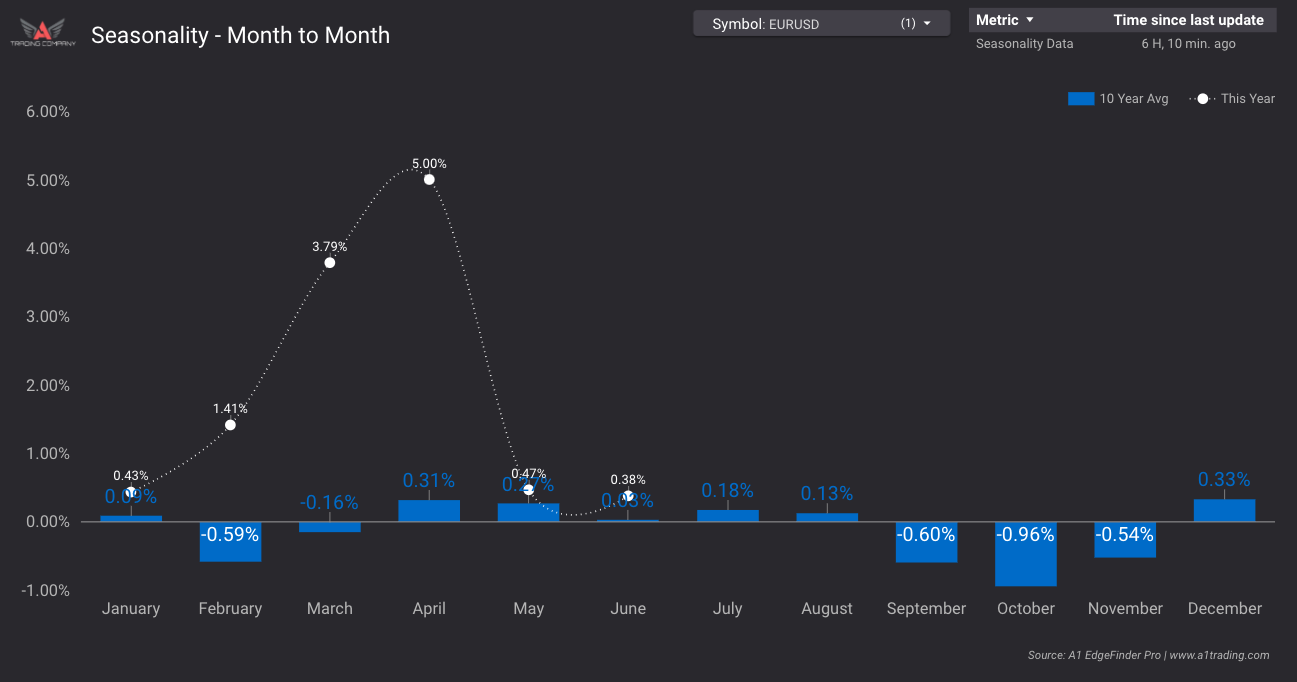
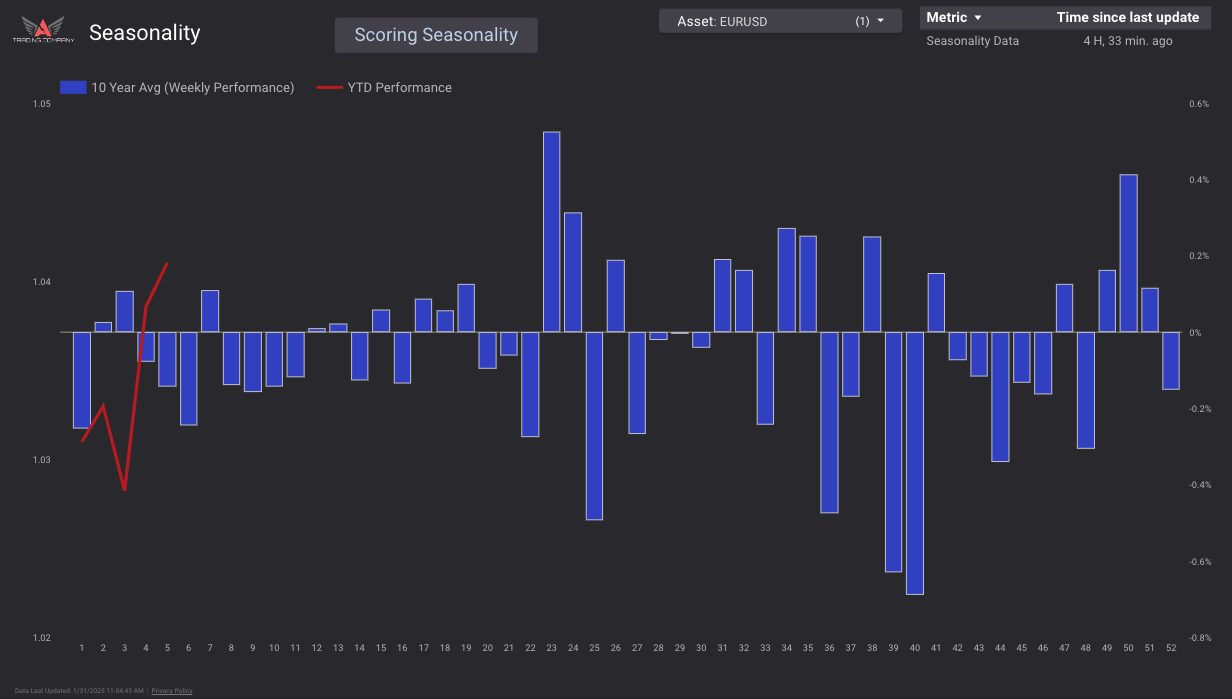
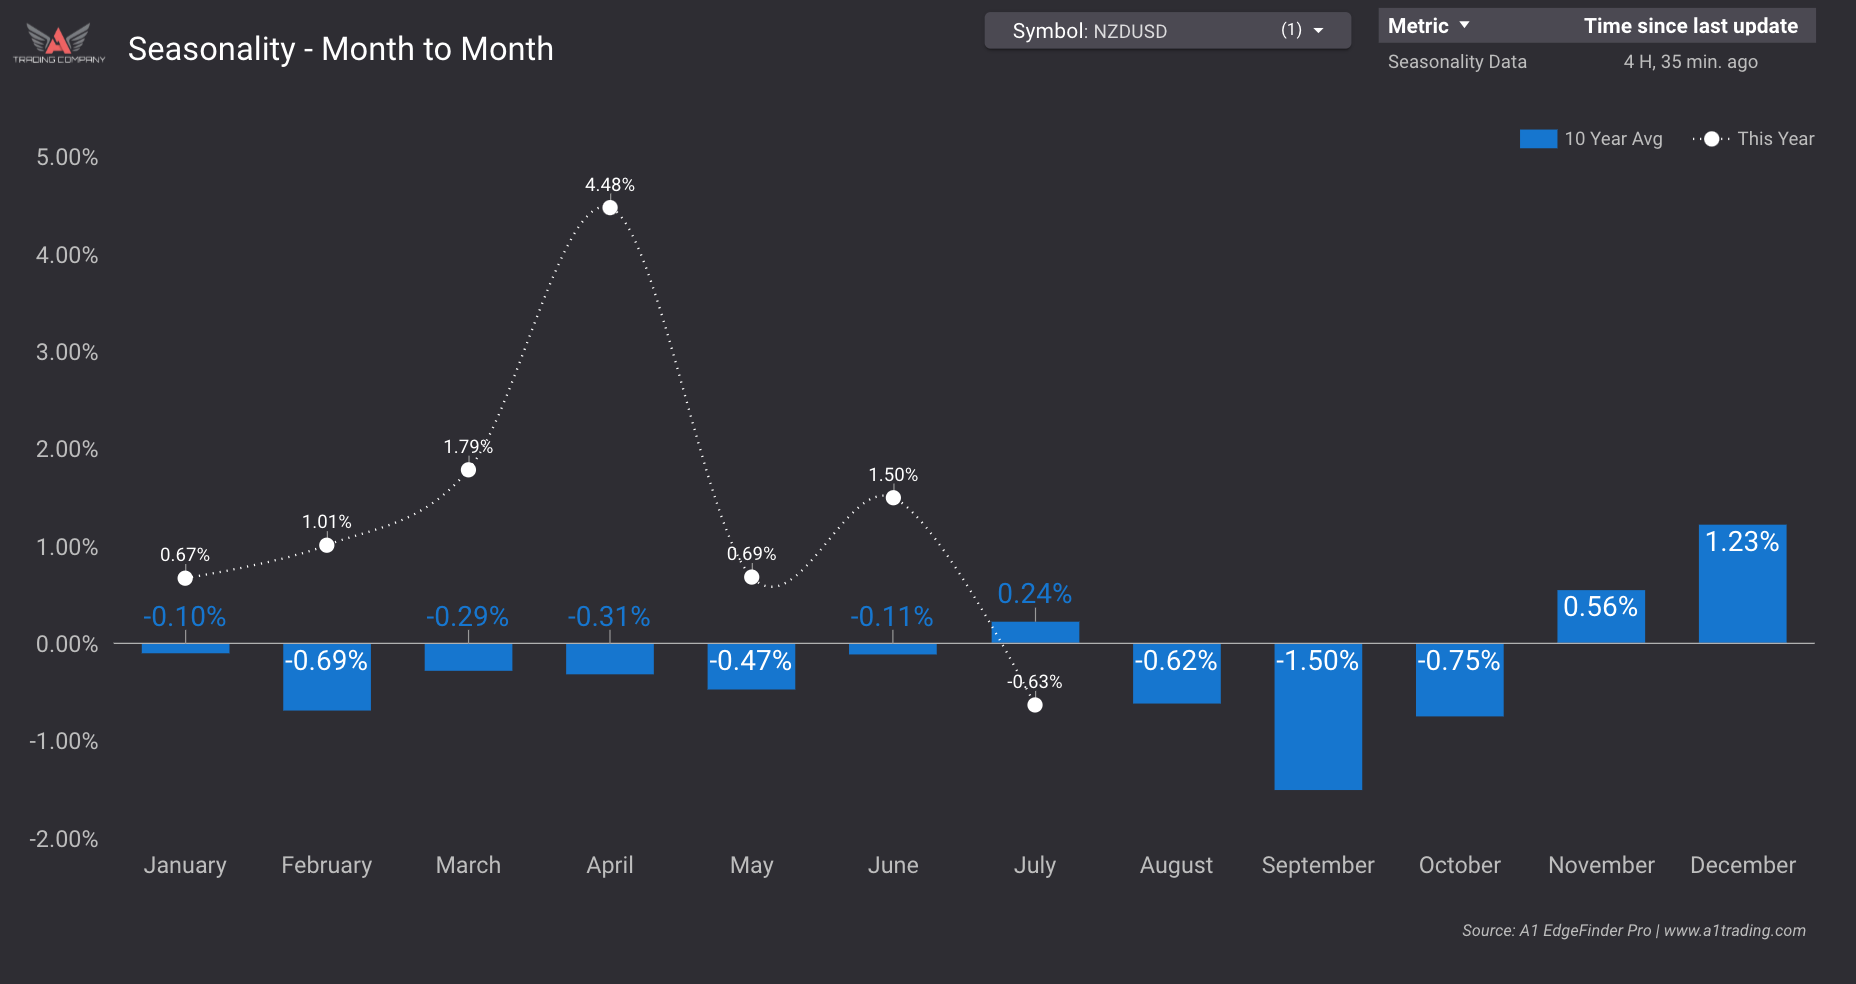
The Seasonality Score leverages historical data to highlight average monthly and weekly performance trends, helping traders make informed decisions based on recurring market behaviors. Seasonality in financial markets reflects the idea that certain assets often follow predictable patterns during specific times of the year.

Understanding Seasonality

While not as widely used as other tools, seasonality is a simple yet powerful addition to trading analysis, enhancing probability calculations based on historical performance.
Month-by-Month Analysis:
Historical average performance data shows how assets typically perform across each month. For instance, February has shown an average 71% gain over the last 10 years for the S&P 500, reflecting trends like the well-known “Santa Claus rally” in December, where markets often perform positively.

Weekly Patterns: 
Alongside monthly trends, there are also “Week of the Year” performance trends, offering even finer granularity for precise timing.
Reading the Data:
Monthly Patterns: Each month displays its average return, with positive scores indicating months where an asset has historically shown gains, and negative scores indicating a tendency for losses.

Applying the Data: 
The seasonality score reflects the current month’s historical performance. For example, if it’s August and historical data for August is positive, the asset is assigned a positive score.

Quick Analysis Tool: 
The seasonality score is integrated with EdgeFinder’s scoring algorithm, impacting the overall score for each asset. This allows traders to quickly assess whether the historical seasonality supports their current market analysis.
edgefinder seasonality. Market Seasonality: Uncovering Key Trends with Data Averages
Week of Year Trends for EURUSD
Seasonality monthly NZDUSD
Month of Year Trends for DXY

How is the EdgeFinder's Seasonality Score Calculated?

Seasonality Calculation For Indices & Commodities

For indices and commodities, the EdgeFinder assigns a seasonality score of either -2 or +2.

If the current month's 10 year historical average performance is positive, the EdgeFinder assigns a +2 to the seasonality score. If the current month's 10 year historical average performance is negative, the EdgeFinder assigns a -2 to the seasonality score.

The reason this seasonality score weighting value is higher than for currency pairs, is that seasonal tendencies are very pronounced in indices & commodities.

This score is then factored in to the total score produced by the EdgeFinder.

Seasonality Calculation For Currency Pairs

For currency pairs, the EdgeFinder assigns a seasonality score of either -1 or +1.

If the current month's 10 year historical average performance is positive, the EdgeFinder assigns a +1 to the seasonality score. If the current month's 10 year historical average performance is negative, the EdgeFinder assigns a -1 to the seasonality score.
Frequently Asked Questions (FAQs)
View more FAQs here.

What time frames can you use the edgeFinder on?

The EdgeFinder gives directional bias and is not time based. Therefore, there is not a specific time frame that is best for the EdgeFinder.

What assets are included on the EdgeFinder?

Forex Majors:
AUDUSD, NZDUSD, USDZAR, GBPUSD, USDJPY, USDCAD, USDCHF, EURUSD

Forex Minors:
AUDCAD, AUDCHF, AUDJPY, AUDNZD, CADCHF, CADJPY, CHFJPY, EURAUD, EURCAD, EURCHF, EURGBP, EURJPY, EURNZD, GBPAUD, GBPCAD, GBPCHF, GBPJPY, GBPNZD, NZDCAD, NZDCHF, NZDJPY

Metals:
XAUUSD, PLATINUM, SILVER, COPPER

Energy:
USOIL

Indices:
GER30, US30, SPX500, US10Y, NAS100, JP225, UK100, RUSSELL

Bonds:
US10Y

Is the EdgeFinder realtime?

While the EdgeFinder is not necessarily realtime, it is fully automatic in its data collection. The EdgeFinder uses a variety of data sources and inputs. Most price data updates are on a 15 minute timer, while economic data updates every few hours. COT data updates weekly (as it only releases 1 time per week), and retail sentiment updates every 30 minutes.

Video Tutorials

How To Use Seasonality
How to Trade Seasonality like a PRO | Month of the Year Trends!

Find your trading edge

Take the guesswork out of trading with the EdgeFinder.
View Discounts>>

access now

Take a full tour!

Check out our EdgeFinder tour page to take a deep dive into all its unique features!

Go to tour

Home
Edgefinder
StockBox
Signals

LINDEX Company

LINDEX is a leading financial analysis and trading education company dedicated to empowering traders of all levels. Our team combines extensive market knowledge with cutting-edge technology to provide valuable insights and tools for traders worldwide.
2025 All Rights Reserved | LINDEX Company
Leveraged trading in foreign currency contracts or other off-exchange products on margin carries a high level of risk and is not suitable for everyone. You may lose more than you invest. Price and performance data is provided for informational purposes only and is not investment advice. Past performance is not indicative of future results.

There is a significant degree of risk involved in trading securities. With respect to foreign exchange trading, there is considerable risk exposure, including but not limited to, leverage, creditworthiness, limited regulatory protection and market volatility that may substantially affect the price, or liquidity of a currency or currency pair. CFDs are complex instruments and come with a high risk of losing money rapidly due to leverage. The vast majority of retail client accounts lose money when trading in CFDs. You should consider whether you can afford to take the high risk of losing your money.
homesmartphonelaptop-phonechart-barscross-circle
linkedin facebook pinterest youtube rss twitter instagram facebook-blank rss-blank linkedin-blank pinterest youtube twitter instagram