How does the EdgeFinder score COT data in its scoring system?
Why We Use Non-Commercial / Large Speculator Data
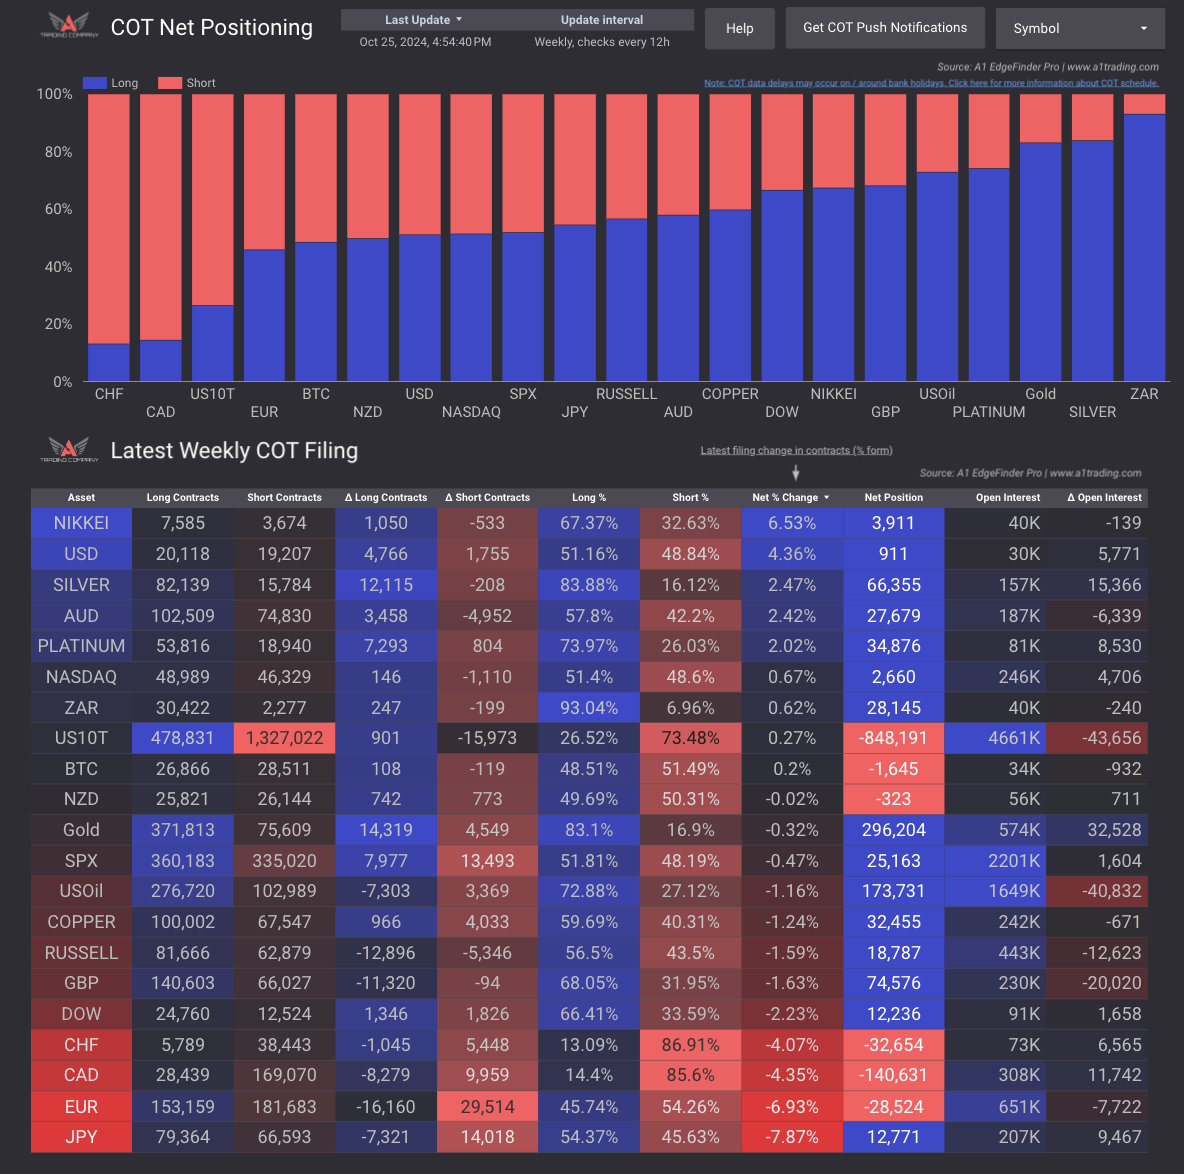
The non-commercial commitment of traders data is an excellent way for traders to track what large speculators in the market are buying or selling. The EdgeFinder assigns a more bullish reading to assets that large speculators taking a bullish position in, and a more bearish reading to assets that large speculators are taking a bearish position in.
EdgeFinder COT Data Scoring (Currency Pairs)
Logic for Currency Pairs:
The EdgeFinder's score for COT data in regards to currency pairs considers the latest institutional buying or selling that took place in each respective currency, according to the latest report.
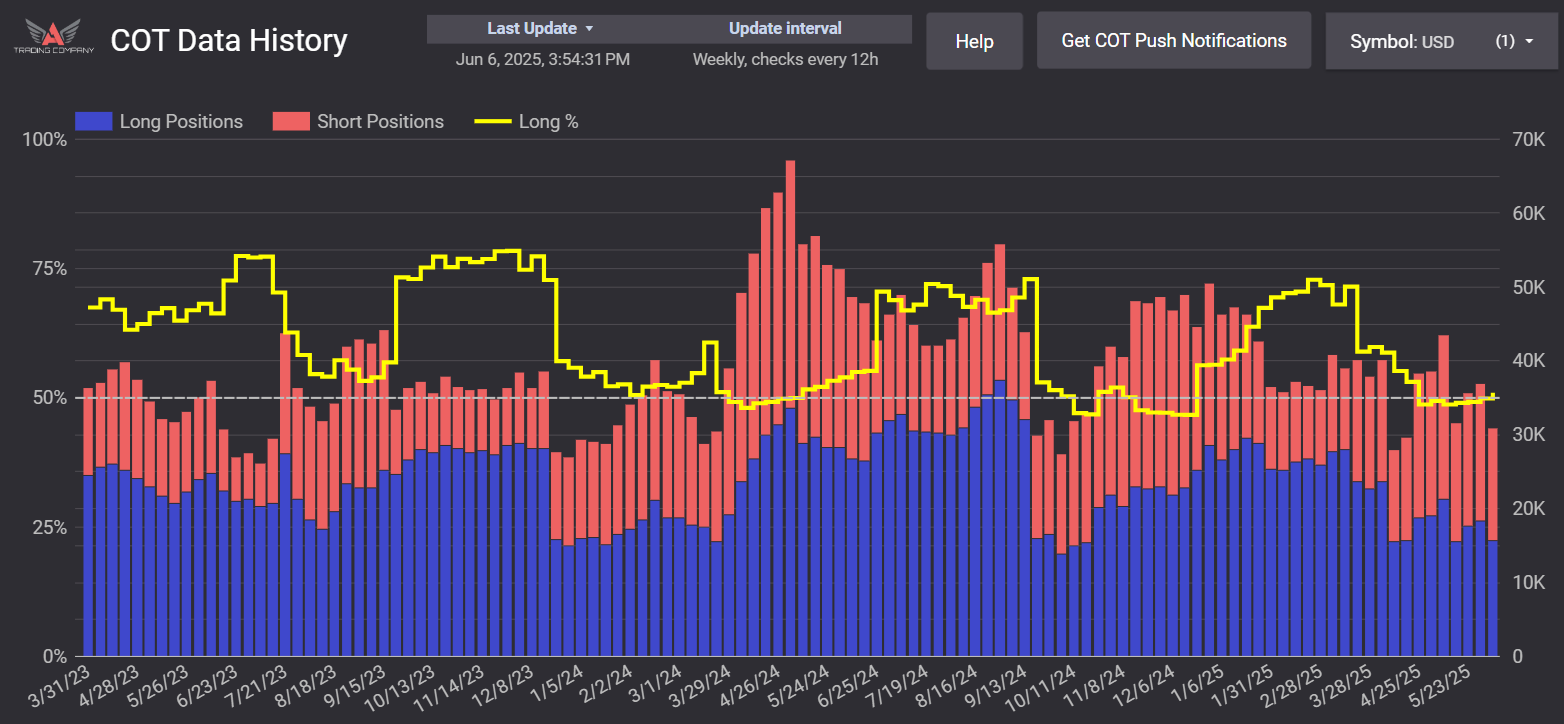
First, the EdgeFinder will automatically calculate (and showcase) the weekly % change in institutional positioning.
To get this value, the EdgeFinder finds the difference between the currencies previous week's net long % and the currencies latest net long %. (Long% current - Long% Previous)
The easiest way to demonstrate this is through an example. Let's assume we are looking at 'EURUSD'. For our example, 'EUR' is currency A, and 'USD' is currency B.
First, we will consider currency A. If the EdgeFinder detects a positive value in week over week % change for currency A, the COT score for the currency pair is increased by +1. If weekly % change is negative, the COT score for the currency pair is decreased by 1 (-1).
Then, we consider currency B, the EdgeFinder repeats this process, but inverts the score impact due to this being the counter to the base currency (currency A). So, if the EdgeFinder detects a positive value in week over week change for currency B, the COT score for the currency pair is decreased by 1 (-1). If it is negative, the COT score for the currency pair is increased by +1.
EdgeFinder COT Data Scoring (Indices/Commodities/Crypto)
LOGIC FOR INDICES, COMMODITIES, CRYPTO AND METALS :
For scoring non currency pairs, the EdgeFinder considers the latest COT reported change in institutional buying/selling, as well as the overall net average positioning for each asset.
Let's do an example to showcase how this calculation works. For our example, let's say we are considering the EdgeFinder's COT score on gold.
Part 1: latest change in buying/selling
First, the EdgeFinder will automatically calculate (and showcase) the weekly % change in institutional positioning.
To get this value, the EdgeFinder finds the difference between the asset's previous week's net long % and the asset's latest net long %. (Long% current - Long% Previous)
If the weekly % change is a positive value, that indicates that on a net basis, the EdgeFinder detects institutional bullishness. If this weekly % change is a negative value, that would suggest bearishness.
If the net weekly % change is positive, the EdgeFinder increases the asset's COT data score by +1. If negative, it decreases the asset's COT data score by 1 (-1).
Part 2: Net positioning
The net position column within the EdgeFinder's COT data page showcases the current total (long-short contracts) positions overall in a particular asset.
If the net position calculation is positive, long positions outweigh short positions, and we would say net positioning is bullish. If this number is negative, short positions outweigh long positions, and we would say net positioning is bearish.
If net positioning is bullish, the asset's COT score is increased by +1. If net positioning is bearish, the asset's COT score is decreased by 1 (-1).
Part 3: Summation!
Finally, the EdgeFinder takes the summed up total of part 1 and part 2 to create a final COT score, that will range from -2 to +2. This is then factored in to the EdgeFinder's total output score automatically.
How we calculate net % change
COT NET % CHANGE CALCULATION
To calculate the net % change value,
First, the EdgeFinder calculates the current percentage of long contracts relative to total open contracts. We call this the current long % value.
The calculation for current long % value is as follows:
(current # long contracts / (current # long + current # short contracts))
Then, the EdgeFinder calculates the previous week's long % value.
The calculation for previous week's long % value is as follows:
(previous week's # long contracts / (previous week's # long contracts + previous week's # short contracts))
Finally, to calculate the net % change value, the calculation is:
(current week's long % - previous week's long %)
Example:
If last week the net long % was 55%, and the current week is 57%, that would result in a net % change of 2%. By using the net long %, we account for the change in both long and short contracts week over week.
View more FAQs here.
What time frames can you use the edgeFinder on?
The EdgeFinder gives directional bias and is not time based. Therefore, there is not a specific time frame that is best for the EdgeFinder.
What assets are included on the EdgeFinder?
Forex Majors:
AUDUSD, NZDUSD, USDZAR, GBPUSD, USDJPY, USDCAD, USDCHF, EURUSD
Forex Minors:
AUDCAD, AUDCHF, AUDJPY, AUDNZD, CADCHF, CADJPY, CHFJPY, EURAUD, EURCAD, EURCHF, EURGBP, EURJPY, EURNZD, GBPAUD, GBPCAD, GBPCHF, GBPJPY, GBPNZD, NZDCAD, NZDCHF, NZDJPY
Metals:
XAUUSD, PLATINUM, SILVER, COPPER
Energy:
USOIL
Indices:
GER30, US30, SPX500, US10Y, NAS100, JP225, UK100, RUSSELL
Bonds:
US10Y
Is the EdgeFinder realtime?
While the EdgeFinder is not necessarily realtime, it is fully automatic in its data collection. The EdgeFinder uses a variety of data sources and inputs. Most price data updates are on a 15 minute timer, while economic data updates every few hours. COT data updates weekly (as it only releases 1 time per week), and retail sentiment updates every 30 minutes.