40% Off Signals

Understanding The MACD Indicator

technical Analysis Course
The Moving Average Convergence Divergence (MACD) indicator is one of the most popular tools in technical analysis. It helps traders identify potential bullish or bearish signals in a given market by analyzing the relationship between two exponential moving averages (EMAs). Due to its simplicity and effectiveness, the MACD has become a staple in many traders' toolkits. However, like all indicators, it is not foolproof and should be used as part of a broader trading strategy rather than in isolation.

how the mACD is calculated

The MACD indicator is derived from three main components:
MACD Line: This is calculated by subtracting the 26-period Exponential Moving Average (EMA) from the 12-period EMA. This line reflects the difference between short-term and long-term price movements.
Signal Line: A 9-period EMA of the MACD line, which helps smooth out fluctuations and provides a clearer signal.
Histogram: This represents the difference between the MACD line and the signal line. The histogram is useful for identifying the strength of a trend, as its bars expand and contract depending on the distance between the two lines.

How to Interpret the MACD

The MACD indicator is primarily used to generate buy and sell signals based on the interaction between the MACD line and the signal line.

Bullish Signals

When the MACD line crosses above the signal line, it is interpreted as a bullish signal, indicating that upward momentum may be increasing. Traders often take this as a cue to enter long positions, anticipating further price appreciation.

Bearish Signals

Conversely, when the MACD line crosses below the signal line, it is considered a bearish signal. This suggests that downward momentum may be increasing, prompting traders to consider selling or shorting an asset.

MACD Divergence

Divergence occurs when the price of an asset moves in the opposite direction of the MACD indicator. This can be a powerful signal that a trend reversal may be imminent.
Bullish Divergence: When price forms lower lows while the MACD forms higher lows, it may indicate weakening bearish momentum and a potential price reversal to the upside.
Bearish Divergence: When price forms higher highs while the MACD forms lower highs, it can signal weakening bullish momentum and a possible reversal to the downside.

MACD in Action: A Practical Example

To better understand the MACD, let's look at a practical example.

Chart Example

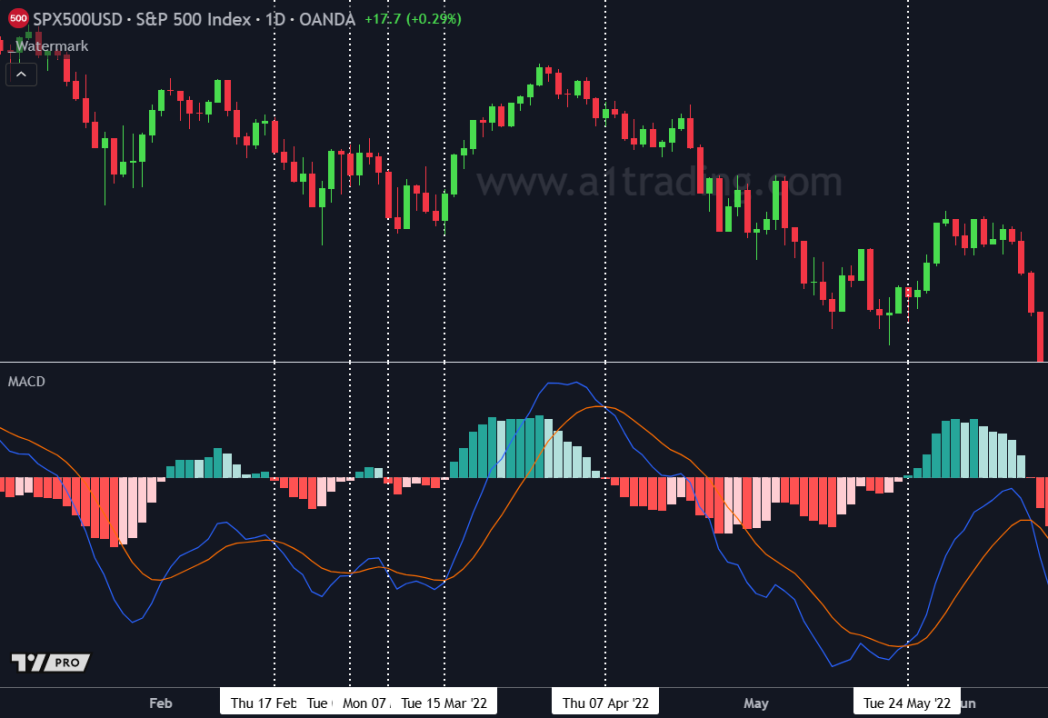
On a typical MACD chart, you will see:
The MACD line (commonly shown in blue)
The signal line (commonly shown in orange)
A histogram that reflects the difference between the two lines
When the blue MACD line crosses above the orange signal line, it signals a potential uptrend, suggesting a buying opportunity. Conversely, when the blue MACD line crosses below the orange signal line, it signals a potential downtrend, suggesting a selling opportunity.

However, it's essential to note that while these signals can be useful, they are not always 100% accurate. Sometimes, the MACD may cross above or below the signal line without resulting in a significant price movement. This is why traders often use the MACD in combination with other indicators, such as Relative Strength Index (RSI) or support and resistance levels, to increase the probability of making accurate predictions.
MACD indicator Moving Average Convergence Divergence

Strengths and Limitations of the MACD Indicator

strengths

Versatile Indicator: The MACD can be used for identifying trend direction, momentum shifts, and potential entry and exit points.

Clear Buy/Sell Signals: Crossovers between the MACD line and signal line provide straightforward trading signals.

Works on Different Timeframes: The MACD can be applied to short-term, medium-term, and long-term charts, making it suitable for different trading styles.

Easy to Interpret: Even beginner traders can understand the MACD with minimal experience.

limitations

Lagging Indicator: Since the MACD is based on moving averages, it is inherently a lagging indicator, meaning it follows price action rather than predicting it.

False Signals: The MACD can generate false signals, especially in ranging or choppy markets where price moves sideways without a clear trend.

Not Ideal for Volatile Markets: In highly volatile conditions, the MACD may produce erratic signals that can mislead traders.

Should Be Used with Other Indicators: The MACD works best when combined with other technical analysis tools such as RSI, Bollinger Bands, or volume analysis.

Best Practices for Using the MACD Indicator

1. Combine with Other Indicators

To improve accuracy, many traders use the MACD alongside other indicators. For instance:
MACD + RSI: The MACD can help identify trend direction, while the RSI can confirm whether an asset is overbought or oversold.
MACD + Moving Averages: Longer-term moving averages can provide additional trend confirmation.
MACD + Support and Resistance Levels: Using MACD signals near key support or resistance levels can improve trade accuracy.

2. Use Multiple Timeframes

Analyzing the MACD on different timeframes can help traders get a clearer picture of market trends. For example, a trader might use the MACD on the daily chart to determine the overall trend while using a shorter timeframe (such as a 1-hour or 4-hour chart) to fine-tune entry points.

3. Avoid Trading in Sideways Markets

The MACD is most effective in trending markets. In ranging conditions, the MACD may produce multiple crossover signals that result in false entries and exits.

4. waiting for confirmation

Instead of acting on every MACD crossover, traders should wait for additional confirmation, such as increased trading volume, candlestick patterns, or breaks of key support/resistance levels.
The MACD indicator is a powerful tool for technical traders, providing valuable insights into market trends and momentum shifts. While it offers clear buy and sell signals, it is not without its drawbacks. Traders should always use the MACD alongside other technical indicators and risk management strategies to enhance their decision-making process. By understanding its strengths and limitations, traders can make more informed trading choices and increase their chances of success in the financial markets.

Key Takeaways

The MACD is a widely used momentum indicator that helps traders identify potential trend reversals and trade entry/exit points.
It consists of the MACD line, the signal line, and a histogram that measures the difference between them.
A bullish signal occurs when the MACD line crosses above the signal line, while a bearish signal occurs when it crosses below.
Divergences between price action and the MACD can indicate potential trend reversals.
The MACD is most effective in trending markets but can produce false signals in choppy or sideways conditions.
It should be used in conjunction with other technical analysis tools for better accuracy.

Free Telegram

Join free telegram for analysis, trade ideas, & trading resources!

Join telegram

Related Videos

How to trade moving averages

Continue learning technical analysis:

Back to course home
  • Trendlines

    Learn how to draw and utilize trendlines in your technical analysis!
    How To Trade Forex Using Trendlines
    Mastering Trendlines For Pullbacks & Breakouts

    Start lesson

  • Moving Averages

    Learn all about moving averages, and how to trade with them!
    how to trade moving averages
    understanding price action

    Start lesson

  • Relative Strength Index

    Learn all RSI, and how to trade with it!
    How To Trade The RSI Profitably
    Relative Strength Index Example

    Start lesson

  • MACD Indicator

    Learn all about the MACD indicator, and how to trade with it!
    MACD example

    Start lesson

  • Candlestick Pattern Basics

    Learn all about candlestick patterns, how to spot them, and how to trade them!
    How to read candlesticks

    Start lesson

Home
Edgefinder
StockBox
Signals

LINDEX Company

LINDEX is a leading financial analysis and trading education company dedicated to empowering traders of all levels. Our team combines extensive market knowledge with cutting-edge technology to provide valuable insights and tools for traders worldwide.
2025 All Rights Reserved | LINDEX Company
Leveraged trading in foreign currency contracts or other off-exchange products on margin carries a high level of risk and is not suitable for everyone. You may lose more than you invest. Price and performance data is provided for informational purposes only and is not investment advice. Past performance is not indicative of future results.

There is a significant degree of risk involved in trading securities. With respect to foreign exchange trading, there is considerable risk exposure, including but not limited to, leverage, creditworthiness, limited regulatory protection and market volatility that may substantially affect the price, or liquidity of a currency or currency pair. CFDs are complex instruments and come with a high risk of losing money rapidly due to leverage. The vast majority of retail client accounts lose money when trading in CFDs. You should consider whether you can afford to take the high risk of losing your money.
homesmartphonelaptop-phonechart-barscross-circle
linkedin facebook pinterest youtube rss twitter instagram facebook-blank rss-blank linkedin-blank pinterest youtube twitter instagram