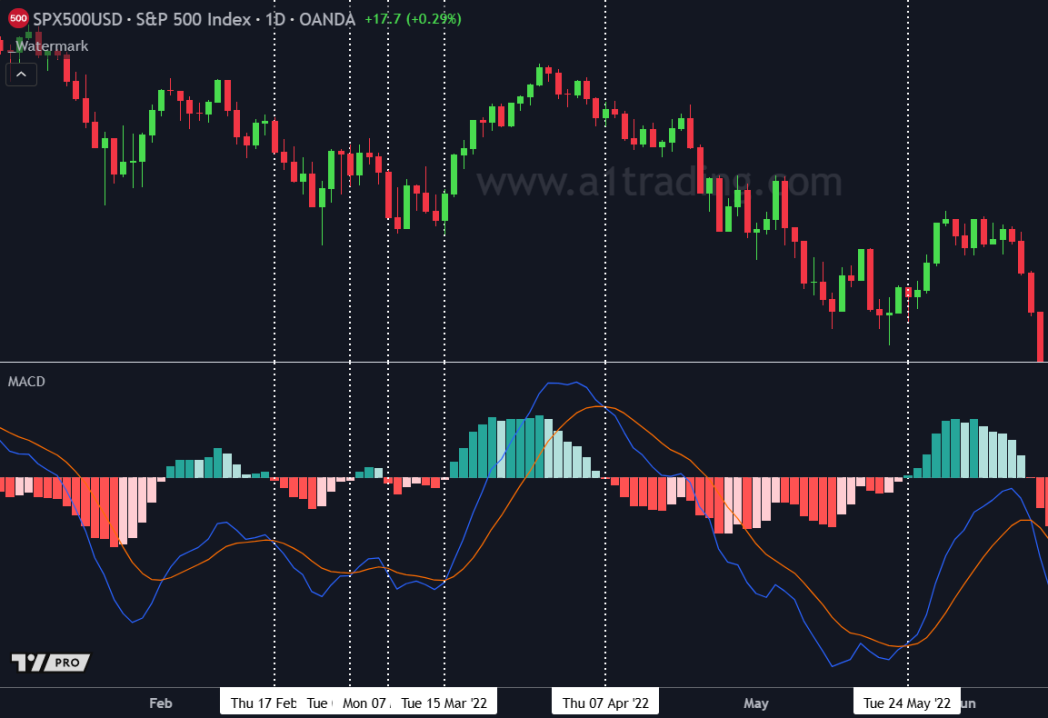
When the blue MACD line crosses above the orange signal line, it signals a potential uptrend, suggesting a buying opportunity. Conversely, when the blue MACD line crosses below the orange signal line, it signals a potential downtrend, suggesting a selling opportunity.
However, it's essential to note that while these signals can be useful, they are not always 100% accurate. Sometimes, the MACD may cross above or below the signal line without resulting in a significant price movement. This is why traders often use the MACD in combination with other indicators, such as Relative Strength Index (RSI) or support and resistance levels, to increase the probability of making accurate predictions.