40% Off Signals

Welcome to the StockBox Tour

Welcome to the StockBox Tour — your guide to exploring the platform’s features and learning how to put them to work in your trading or investing. Whether you’re brand new or already familiar with the StockBox, this page walks you through everything from financial screening and sentiment tracking to the scoring system—so you can see how it highlights real stock opportunities.
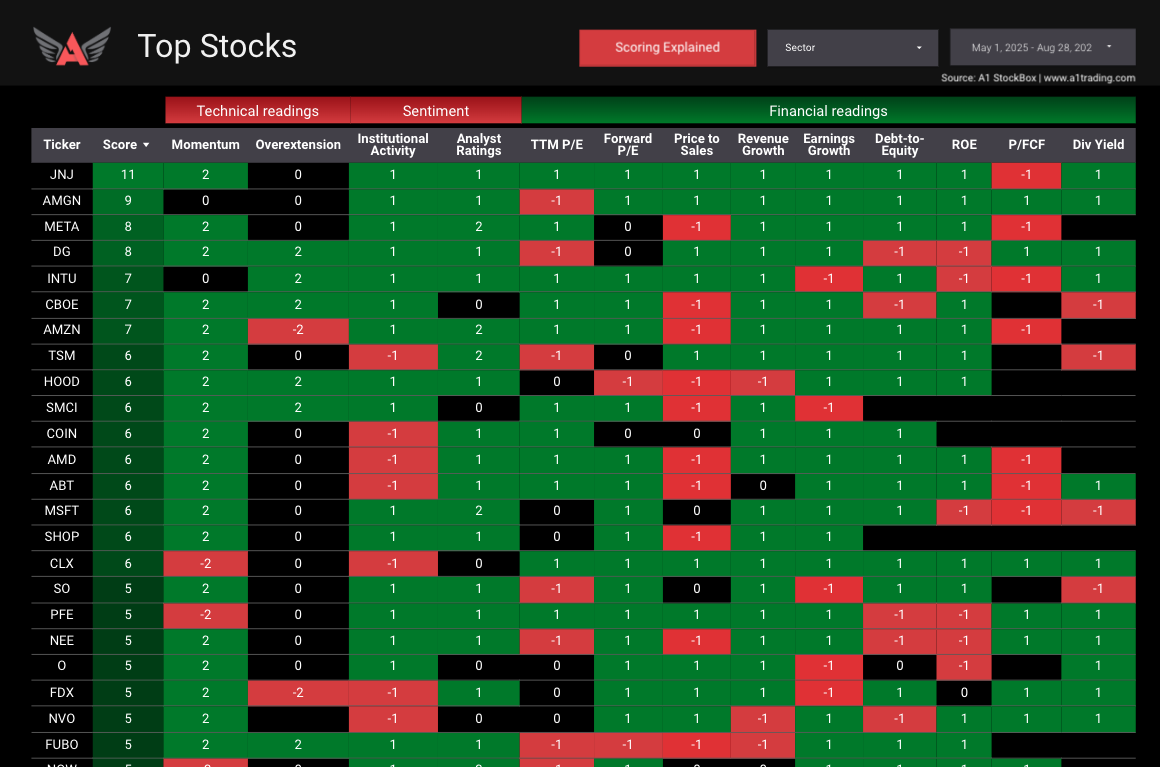
StockBox Top Stocks
Top Stocks
13F Institutional tracker
AAII Investor Sentiment Survey StockBox
AAII investor sentiment
Put-call ratio stockbox
put-call ratio
Headline Sentiment
headline Sentiment

How to Trade with the StockBox:

*Important note: For the best results, the StockBox should be used alongside your own strategy, technical analysis, and risk management. It’s designed to help you make more informed decisions—not make them for you.
Step 1: Identify Opportunities
Start by visiting the Top Stocks or Top Sectors Page page, where the StockBox highlights stocks / sectors with the strongest bullish and bearish scores. These rankings are based on a combination of fundamental factors, helping you quickly spot potential trade setups.
StockBox Top Stocks
Step 2: Confirm with Your Analysis
Compare the StockBox's top-rated setups with your own technical analysis. Does an asset align with your trading strategy? Look for confluence between the StockBox's insights and your preferred indicators, chart patterns, or price action signals.
Step 3: Make an Informed Decision
Once you’ve found a setup that matches your analysis, consider refining your entry and exit points based on support, resistance, and risk management principles. Use the StockBox's in-depth data to strengthen your conviction before placing a trade.

StockBox - Top Stocks Screener: Find Better Stock Trades!

This Institutional Tracker Tool Shows What Stocks Institutions are Buying...

Stockbox - Earnings Report Tracker: Study Stock Earnings Patterns!

Unbox Smarter Insights

Make informed stock trading decisions with confidence using the StockBox
View Discounts>>

Access now

Intro
Top Stocks
Top Sectors
Stock Analyzer
Put-Call Ratio
AAII Investor Sentiment
Stock Comparison
13F Portfolio Tracker
Sector Comparison
Headline Sentiment
Heatmap
Welcome to the StockBox tour!
Here, you'll get an inside look at how the StockBox can transform your stock market strategy. Designed to simplify complex data and deliver powerful insights, the StockBox provides real-time analysis, customized recommendations, and key market metrics all in one place. Whether you’re tracking stocks, scanning for trade setups, or diving into financial trends, the StockBox helps you find opportunities and make informed decisions with confidence.

Ready to take your trading to the next level? Let’s dive in and show you what the StockBox can do!
Top Stocks
Explore our top stock picks, carefully selected based on key fundamental metrics from each company’s income statement, balance sheet, cash flow statement, and earnings report. Each stock is given a score that reflects both its current performance and its forecasted future potential.

Since markets are forward-looking, our analysis places greater emphasis on the stock’s future outlook, while still considering its present financial health. This approach helps you identify stocks with strong growth potential.
Top Sectors
The Top Sectors page allows traders to view an overall score for each major sector, derived from key US economic numbers. The Top Sectors page tracks sectors like technology, financials, and real estate, listing them by score in descending order.

The Top Sectors page generates each score based on key economic data, including latest GDP numbers, manufacturing PMI numbers, services PMI numbers, retail sales data, CPI, employment change (NFP), unemployment rate, and interest rates.
Stock Analyzer
Gain an in-depth analysis of stock performance using a range of metrics that evaluate a stock's health relative to its historical performance, industry peers, and overall sector.
Put-call Ratio
The put/call ratio is a measure of investor sentiment in the options market. The measurement is proportional to the total amount of calls and puts purchased in a given time period. For this indicator, we’re viewing how many contracts are being purchased each day. If there are a larger number of puts than calls in the market, sentiment is cautious and/or risk averse. If there are a larger number of calls than puts, sentiment could be viewed as bullish.
AAII Investor Sentiment
The American Association of Individual Investors (AAII) conducts a weekly survey to gauge where individual investors believe the market will head in the next 6 months. Released every Wednesday by 11:59 p.m., this survey tracks the overall market sentiment over time.

Each vertical bar in the chart displays three sentiment segments: bullish, neutral, and bearish. The yellow line across the chart represents the bull-to-bear spread, where a positive spread indicates a bullish leaning, and a negative spread signals bearish sentiment.
Stock Comparison
The Stock Comparison Tool helps you evaluate the strengths and weaknesses of multiple stocks side by side. By analyzing key performance indicators and forecasts, this tool enables traders to identify which stocks may offer better investment potential. With a heavy focus on future forecasts and change, we look for how the company has performed in reference to last quarter as well as where the stock could be heading next quarter.
13F Portfolio Tracker
13F reports provide insight into the quarterly transactions of large institutional investors, similar to COT reports. However, these filings are released with a delay—up to 45 days after the quarter ends—so it’s crucial to focus on investors with a long-term outlook. By tracking their buying and selling trends, you can identify which institutions are making significant moves in the market.
Sector Comparison
The Sector Comparison Tool allows you to compare individual stocks against their sector to assess whether a company is outperforming or lagging behind its peers. By evaluating how a stock measures up within its sector, you can gain deeper insights into its relative strength or weakness.

When used alongside the Stock Comparison Tool, this feature helps you identify the top-performing stocks and make more informed decisions for building your portfolio.
Headline Sentiment
With the use of AI, we are able to take interpretations of the latest news on any stock. This will keep you up to date of the events happening now to help you make more informative decisions on a stock.

Each stock on our scanner pages will briefly describe the company and include any relative recent news regarding its current state of performance in the industry.
Heatmap
See which stocks and ETFs are moving the most today. You can also use the filters to see which price performance over longer timeframes. Note that the sector performances are relative to the stocks in our list, not the entire sector. You can look at the top performing stocks within each sector by clicking on the sector’s bar. This will pull up the largest moves within that sector.
hello world!
Home
Edgefinder
StockBox
Signals

LINDEX Company

LINDEX is a leading financial analysis and trading education company dedicated to empowering traders of all levels. Our team combines extensive market knowledge with cutting-edge technology to provide valuable insights and tools for traders worldwide.
2025 All Rights Reserved | LINDEX Company
Leveraged trading in foreign currency contracts or other off-exchange products on margin carries a high level of risk and is not suitable for everyone. You may lose more than you invest. Price and performance data is provided for informational purposes only and is not investment advice. Past performance is not indicative of future results.

There is a significant degree of risk involved in trading securities. With respect to foreign exchange trading, there is considerable risk exposure, including but not limited to, leverage, creditworthiness, limited regulatory protection and market volatility that may substantially affect the price, or liquidity of a currency or currency pair. CFDs are complex instruments and come with a high risk of losing money rapidly due to leverage. The vast majority of retail client accounts lose money when trading in CFDs. You should consider whether you can afford to take the high risk of losing your money.
homesmartphonelaptop-phonechart-barscross-circle
linkedin facebook pinterest youtube rss twitter instagram facebook-blank rss-blank linkedin-blank pinterest youtube twitter instagram