40% Off Signals

How to Trade NFP (Non-Farm Payroll)

Fundamental Analysis Course
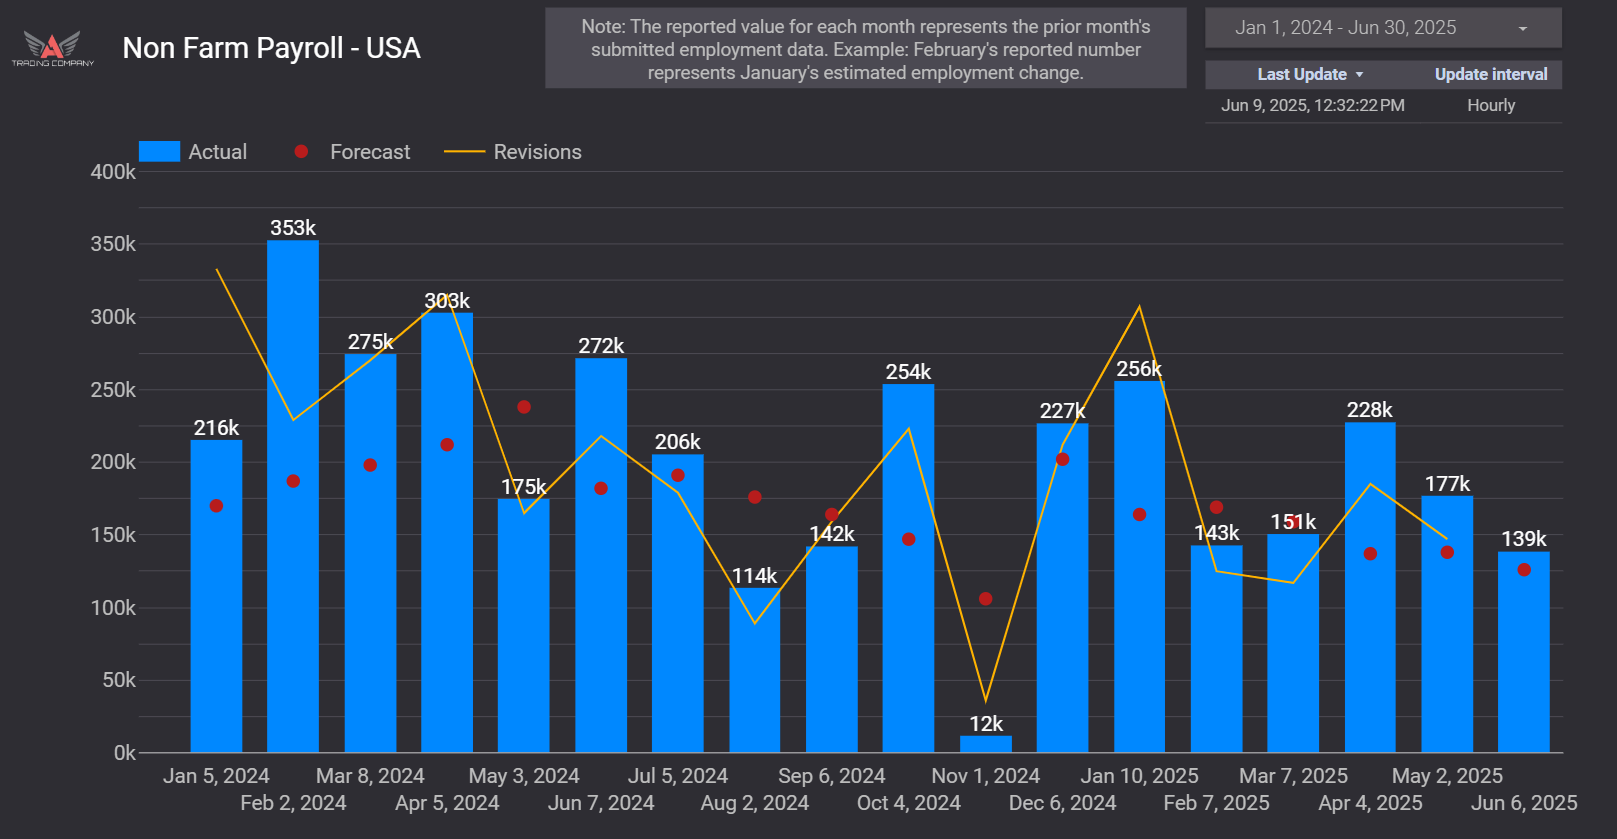
Trading the Non-Farm Payroll (NFP) report can be both a lucrative and volatile experience for traders across the globe. Released monthly by the U.S. Bureau of Labor Statistics, this report provides a snapshot of the U.S. labor market—and because jobs data is so tightly linked to economic strength, this release often sparks significant market moves.

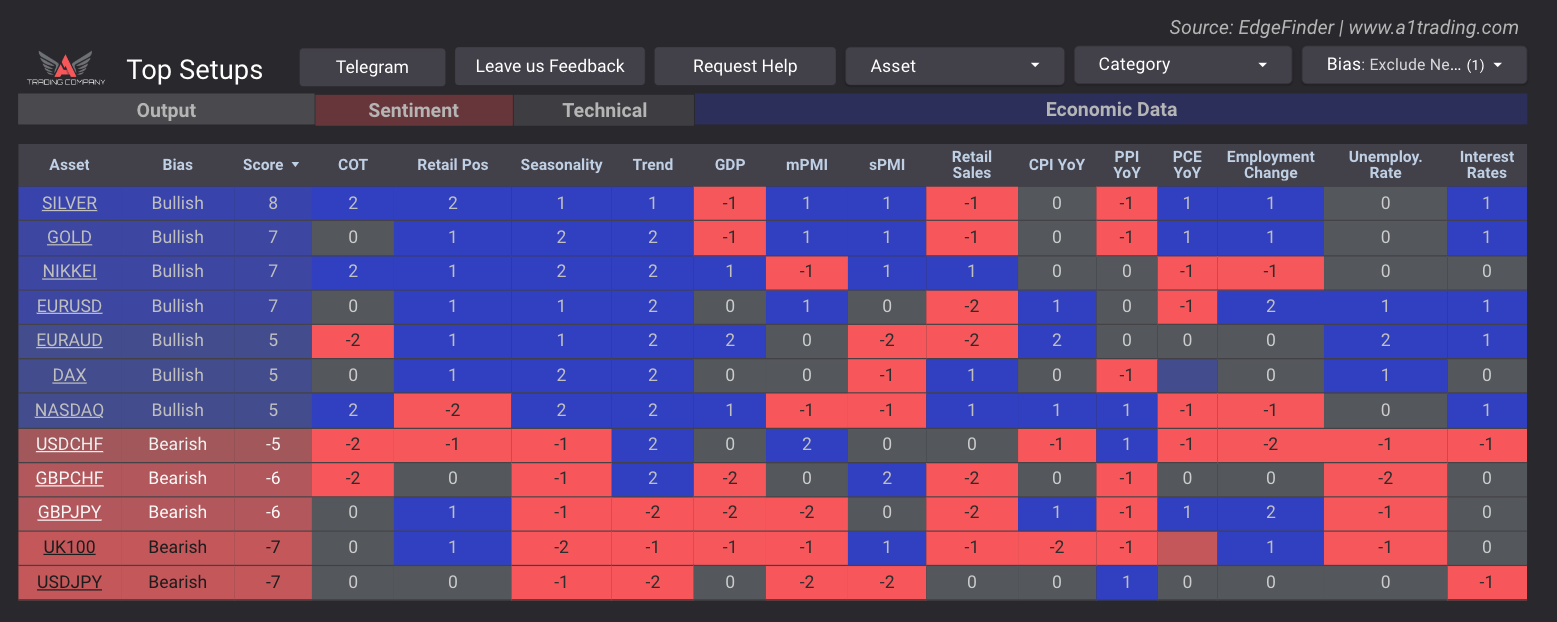
Understanding how to interpret this data, anticipate its market impact, and apply the right strategy is essential for navigating NFP effectively. Below, we’ll break down what the report includes, how to interpret the data, how it affects markets like forex, gold, and stocks—and how tools like the EdgeFinder can streamline your analysis.

what is NFP (Non-farm payroll)?

The Non-Farm Payroll (NFP) report measures the monthly change in the number of employed people, excluding:
Farm workers
Government employees
Private household workers
Employees of non-profit organizations
This metric is one of the most watched indicators of U.S. economic strength. That’s because employment levels directly influence consumer spending, which makes up a significant portion of GDP.

why should traders care?

A stronger-than-expected NFP report suggests a healthy labor market and economy. This is typically bullish for the U.S. dollar (USD) and stocks, but bearish for gold (as gold tends to benefit from uncertainty).

A weaker-than-expected NFP report often leads to USD weakness, stock market pullbacks, and a rise in gold prices due to safe-haven demand.
Non Farm Payroll Data from the EdgeFinder

When Does NFP Come Out?

The NFP report is released on the first Friday of each month at 8:30 AM Eastern Time, reporting the employment changes from the prior month.

For example, on April 4th, the Bureau of Labor Statistics released data for the month of March. This consistent release schedule creates a recurring opportunity for traders—but it also means markets can get volatile very quickly.

The Three Key Numbers in Every NFP Report

When analyzing the NFP report, there are three major statistics traders focus on:

1. Non-Farm Employment Change

This is the headline number—it tells us how many jobs were added (or lost) over the prior month.

Comes with three values:
- Actual – the released figure
- Forecast – the market’s expected number
- Previous – the prior month's result

Stronger-than-expected jobs growth = bullish for USD & stocks, bearish for gold
Weaker-than-expected = bearish for USD & stocks, bullish for gold

2. Unemployment Rate

Measures the percentage of the labor force actively seeking work but unable to find it.
- An increase in unemployment = negative for USD & stocks, positive for gold
- A decline in unemployment = positive for USD & stocks, negative for gold

3. Average Hourly Earnings

Tracks wage growth, indicating how much workers are being paid.
- Stronger wage growth = bullish for USD and stocks, bearish for gold
- Weaker wage growth = bearish for USD and stocks, bullish for gold

How these numbers move the markets

Here’s a simplified breakdown of how the data typically impacts the markets:
Report Outcome
USD Impact
Get Started
Gold Impact
Get Started
Stock Market Impact
Get Started
Strong NFP (above forecast)
Bullish
bearish
Bullish
Strong NFP (above forecast)
bearish
bullish
bearish
Rising Unemployment
bearish
bullish
bearish
Falling Unemployment
Bullish
bearish
Bullish
Strong Wage Growth
Bullish
bearish
Bullish
Weak Wage Growth
bearish
bullish
bearish

But What About Inflation & Interest Rates?

There’s one major caveat: the macroeconomic context matters.

For example, during periods of high inflation, a strong jobs report can actually be bearish for stocks. Why? Because wage growth and strong employment may fuel further inflation—leading the Federal Reserve to raise interest rates aggressively.

When interest rate hikes are expected:
Stocks may fall due to higher borrowing costs.
Gold may rise as a hedge against inflation.
The USD may still strengthen, as higher interest rates attract capital inflows.
In short, traders must consider both the data and the environment to interpret NFP effectively.

automating the hard part with the EdgeFinder

Analyzing economic reports like NFP manually can be overwhelming. That’s why we built the EdgeFinder—our proprietary software tool that tracks, interprets, and scores economic data automatically.

How the EdgeFinder Helps

Displays historical NFP data with actual vs. forecasted numbers
Includes unemployment rates, wage growth, JOLTS data, jobless claims, and more
Uses a unique scoring system to show bullish or bearish bias for major currencies and assets
Saves you time and removes the guesswork from fundamental analysis
Get a discount on your purchase with promo code "READER" at checkout!

Get the edgefinder

Conclusion

The Non-Farm Payroll (NFP) report is one of the most impactful economic events each month, influencing currencies, commodities, and equities through its reflection of U.S. labor market strength. By understanding how to interpret the key statistics—non-farm employment change, unemployment rate, and wage growth—and how they interact with broader economic conditions like inflation and interest rates, traders can make more informed, strategic decisions. Tools like the EdgeFinder can help simplify and automate the analysis process, turning complex fundamentals into actionable insights for everyday traders.

Key Takeaways

The NFP report is released monthly and provides insight into U.S. job creation, excluding the farming sector.
A stronger-than-expected NFP typically strengthens the U.S. dollar and stock market while weakening gold.
The unemployment rate and wage growth also impact market sentiment and are included in the report.
Market reaction to NFP data depends heavily on the broader economic context, especially inflation and Fed policy.
Tools like the EdgeFinder can simplify NFP analysis by automating data interpretation and trend tracking.

Free Telegram

Join free telegram for analysis, trade ideas, & trading resources!

Join telegram

Related Videos

Forex Fundamentals EXPLAINED: How to Trade GDP Growth Figures like a Pro!

Find your trading edge

Take the guesswork out of trading with the EdgeFinder.
View Discounts>>

access now

Continue learning fundamental analysis:

Back to course home
  • Monetary Policy / Tracking Central Banks

    Tracking what the federal banks do and plan to do is essential in a currency’s strength. In this lesson, we cover:
    what is monetary policy?
    What is hawkishness?
    What is dovishness?

    Start lesson

  • Retail Sentiment vs Smart Money

    Sentiment analysis is fundamental in trading analytics. Most investors look to others to see what they’re investing in before they start investing.
    What is a retail trader?
    What is "smart money"?
    How to Trade Retail and Smart Money Sentiment

    Start lesson

  • How Geopolitical Risks Affect The Financial Markets

    Geopolitical risks are factors that can affect the way nations interact with each other. These sorts of conflicts influence market sentiment or even a nation’s GDP. Depending on the type of conflict, certain markets can either suffer or prosper.
    Ways of measuring risk
    Impacts on risk-on markets
    Strategies for investors

    Start lesson

  • How to Trade CPI Data like a PRO

    Inflation is a key economic indicator that provides valuable insights into the broader economic landscape. By understanding and interpreting inflation data, traders can make more informed decisions and navigate the markets with greater confidence and success.
    What is inflation?
    what is CPI?
    how to measure inflation
    how to trade inflation

    Start lesson

  • How to Trade the COT Report

    Learn all about candlestick patterns, how to spot them, and how to trade them!
    What is the COT Report?
    Commercials vs. non-commercials
    The EdgeFinder and COT data
    cons of COT data
    how to use COT data in your trading

    Start lesson

Home
Edgefinder
StockBox
Signals

LINDEX Company

LINDEX is a leading financial analysis and trading education company dedicated to empowering traders of all levels. Our team combines extensive market knowledge with cutting-edge technology to provide valuable insights and tools for traders worldwide.
2025 All Rights Reserved | LINDEX Company
Leveraged trading in foreign currency contracts or other off-exchange products on margin carries a high level of risk and is not suitable for everyone. You may lose more than you invest. Price and performance data is provided for informational purposes only and is not investment advice. Past performance is not indicative of future results.

There is a significant degree of risk involved in trading securities. With respect to foreign exchange trading, there is considerable risk exposure, including but not limited to, leverage, creditworthiness, limited regulatory protection and market volatility that may substantially affect the price, or liquidity of a currency or currency pair. CFDs are complex instruments and come with a high risk of losing money rapidly due to leverage. The vast majority of retail client accounts lose money when trading in CFDs. You should consider whether you can afford to take the high risk of losing your money.
homepushpinsmartphonelaptop-phonechart-barscross-circle
linkedin facebook pinterest youtube rss twitter instagram facebook-blank rss-blank linkedin-blank pinterest youtube twitter instagram