40% Off Signals

Fundamental Analysis vs. Technical Analysis

Fundamental Analysis Course
In the fast-paced world of forex trading, two powerful strategies stand out: fundamental analysis and technical analysis. Both approaches are essential for making informed trading decisions, but they focus on different aspects of the market. Fundamental analysis in forex looks at key economic indicators, such as GDP, inflation, and interest rates, to assess the intrinsic value of a currency pair. On the other hand, technical analysis for forex traders relies on price charts and technical indicators like RSI and MACD to predict market trends and identify optimal entry and exit points. Understanding the key differences between fundamental and technical analysis is crucial for any trader, as combining these two methods can provide a comprehensive strategy that enhances your trading performance. Whether you’re focusing on currency pair analysis or looking to develop forex trading strategies with fundamental analysis, mastering both approaches can give you a competitive edge in the market.

what is Fundamental analysis?

fundamental analysis:

Fundamental analysis serves as the cornerstone of evaluating the intrinsic value of an asset. At its core, it seeks to unravel the narrative behind market movements, examining a myriad of economic, financial, and qualitative factors. These include macroeconomic indicators such as GDP growth, inflation rates, and unemployment figures, as well as industry-specific data and company financial statements.

By analyzing these fundamental factors, traders aim to gain insights into the underlying strength or weakness of an asset. For example, positive earnings reports and robust revenue growth may signal a healthy company poised for future growth, while geopolitical tensions or regulatory changes could spell uncertainty and volatility in the market.

One of the key advantages of fundamental analysis lies in its ability to provide a broader context for market trends and movements. By understanding the fundamental forces driving price action, traders can make more informed decisions about the long-term prospects of an asset, guiding their investment strategies accordingly.

Fundamental Example: The 2008 Financial Crisis

The 2008 financial crisis stands as a stark reminder of the profound impact of fundamental factors on market dynamics. Triggered by the collapse of the subprime mortgage market in the United States, the crisis reverberated globally, leading to widespread economic turmoil and market downturns.
US Non-Farm Payroll (NFP) on the EdgeFinder
At its core, the 2008 financial crisis was fueled by a combination of factors, including lax lending standards, excessive risk-taking by financial institutions, and the proliferation of complex financial products. As subprime mortgage defaults surged and major financial institutions teetered on the brink of collapse, investor confidence plummeted, triggering a domino effect across global markets.

For traders and investors, the lessons of the 2008 financial crisis underscore the importance of understanding fundamental factors and their potential impact on market stability. By staying attuned to economic indicators, financial news, and geopolitical developments, traders can better navigate volatile market conditions and position themselves for long-term success.

Automate your fundamental analysis with EdgeFinder

Combining technical timing with strong fundamentals can give you a real trading edge—but gathering and interpreting fundamental data takes time. EdgeFinder automates this process, pulling the latest economic indicators, sentiment data, and COT reports into one clear dashboard. Quickly see whether the fundamentals lean bullish or bearish, then combine that insight with your technical strategy to find higher probability setups. Start trading smarter with fundamentals today, and save with promo code "READER" at checkout!

Get the edgefinder

what is Technical Analysis? 

technical analysis:

While fundamental analysis provides a macro-level view of market dynamics, technical analysis offers a more granular approach to trading. At its core, technical analysis involves analyzing historical price and volume data to identify patterns, trends, and potential reversal points in the market.

Charting is a fundamental tool in technical analysis, allowing traders to visualize price movements over time and identify key levels of support and resistance. By studying chart patterns such as triangles, flags, and head and shoulders formations, traders can anticipate potential breakouts or trend reversals, guiding their entry and exit points accordingly.

Technical indicators further enhance the precision of technical analysis, providing objective measures of market momentum, volatility, and trend strength. Popular indicators include moving averages, oscillators like the Relative Strength Index (RSI), and momentum indicators such as the MACD (Moving Average Convergence Divergence).

One of the key advantages of technical analysis lies in its ability to provide actionable trading signals based on price action and market dynamics. By identifying patterns and trends in price movements, traders can develop strategies to capitalize on short-term price fluctuations, regardless of broader market sentiment.

the Power of Fundamental and Technical Analysis

While fundamental and technical analyses offer distinct approaches to trading, their true power lies in their synergy. By combining the strengths of both methodologies, traders can gain a comprehensive understanding of market dynamics and enhance their trading strategies.

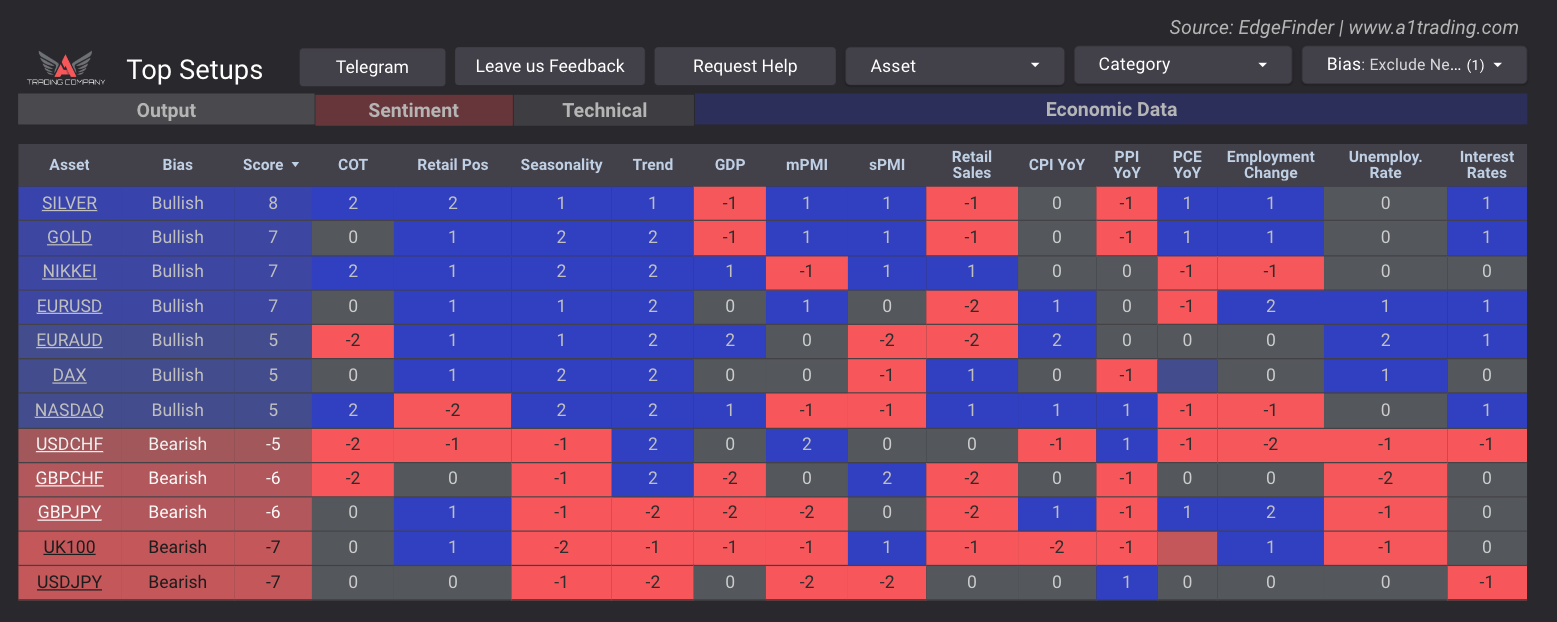
Fundamental analysis provides the underlying context and direction of the market, guiding overall sentiment and market trends. By analyzing economic indicators, financial news, and company fundamentals, traders can identify potential opportunities and risks in the market.

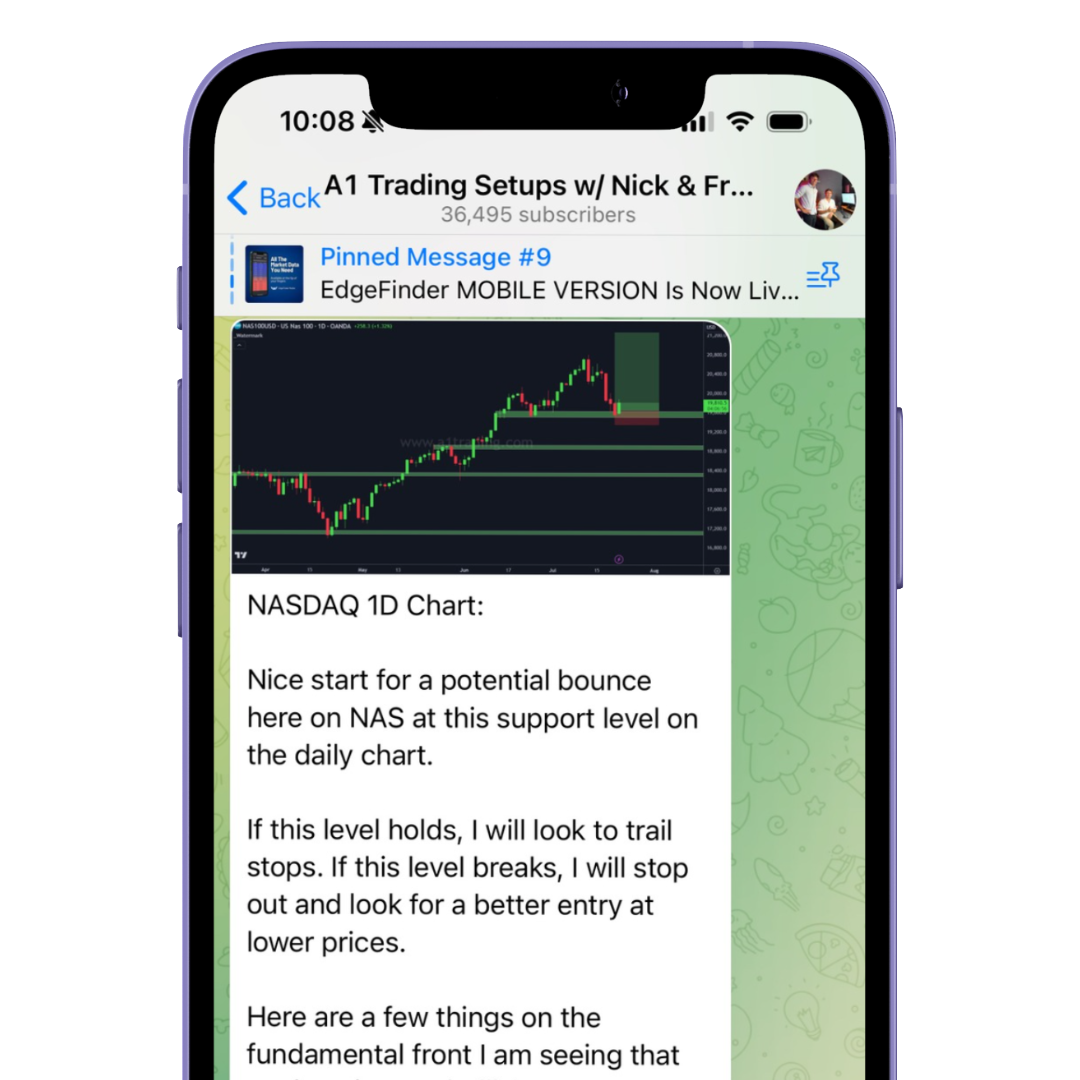
Technical analysis, on the other hand, offers precise timing for entry and exit points, enhancing trade execution and risk management. By analyzing price movements, chart patterns, and technical indicators, traders can pinpoint optimal entry and exit points, maximizing potential profits while minimizing losses.

maximize potential by combining fundamentals & technicals!

By integrating these complementary approaches, traders can maximize their potential for success, combining a deep understanding of market fundamentals with precise timing and execution. Whether trading forex, commodities, indices, or stocks, harnessing the power of fundamental and technical analysis can provide a formidable edge in the competitive world of trading.

Key Takeaways

Fundamental analysis focuses on economic, financial, and qualitative factors affecting an asset’s value, while technical analysis relies on price action and indicators to predict future movements.
Technical Analysis Relies on Price Data: By analyzing historical price and volume data, technical analysis identifies patterns and trends to forecast future price movements, helping traders make short-term decisions.
Fundamental Analysis Provides Market Context: It gives traders a broader understanding of market forces, such as economic conditions and geopolitical events, guiding long-term investment strategies.
Technical Analysis Enhances Trade Execution: It helps traders pinpoint precise entry and exit points based on price patterns and indicators, improving risk management and trade timing.
Combining Both Approaches Strengthens Strategies: Using both fundamental and technical analysis allows traders to understand market trends and make more informed decisions while optimizing trade execution.

Free Telegram

Join free telegram for analysis, trade ideas, & trading resources!

Join telegram

Related Videos

What is the Most Profitable Forex Strategy? Technical Analysis vs. Fundamentals

Find your trading edge

Take the guesswork out of trading with the EdgeFinder.
View Discounts>>

access now

Continue learning fundamental analysis:

Back to course home
  • Monetary Policy / Tracking Central Banks

    Tracking what the federal banks do and plan to do is essential in a currency’s strength. In this lesson, we cover:
    what is monetary policy?
    What is hawkishness?
    What is dovishness?

    Start lesson

  • Retail Sentiment vs Smart Money

    Sentiment analysis is fundamental in trading analytics. Most investors look to others to see what they’re investing in before they start investing.
    What is a retail trader?
    What is "smart money"?
    How to Trade Retail and Smart Money Sentiment

    Start lesson

  • How Geopolitical Risks Affect The Financial Markets

    Geopolitical risks are factors that can affect the way nations interact with each other. These sorts of conflicts influence market sentiment or even a nation’s GDP. Depending on the type of conflict, certain markets can either suffer or prosper.
    Ways of measuring risk
    Impacts on risk-on markets
    Strategies for investors

    Start lesson

  • How to Trade CPI Data like a PRO

    Inflation is a key economic indicator that provides valuable insights into the broader economic landscape. By understanding and interpreting inflation data, traders can make more informed decisions and navigate the markets with greater confidence and success.
    What is inflation?
    what is CPI?
    how to measure inflation
    how to trade inflation

    Start lesson

  • How to Trade the COT Report

    Learn all about candlestick patterns, how to spot them, and how to trade them!
    What is the COT Report?
    Commercials vs. non-commercials
    The EdgeFinder and COT data
    cons of COT data
    how to use COT data in your trading

    Start lesson

Home
Edgefinder
StockBox
Signals

LINDEX Company

LINDEX is a leading financial analysis and trading education company dedicated to empowering traders of all levels. Our team combines extensive market knowledge with cutting-edge technology to provide valuable insights and tools for traders worldwide.
2025 All Rights Reserved | LINDEX Company
Leveraged trading in foreign currency contracts or other off-exchange products on margin carries a high level of risk and is not suitable for everyone. You may lose more than you invest. Price and performance data is provided for informational purposes only and is not investment advice. Past performance is not indicative of future results.

There is a significant degree of risk involved in trading securities. With respect to foreign exchange trading, there is considerable risk exposure, including but not limited to, leverage, creditworthiness, limited regulatory protection and market volatility that may substantially affect the price, or liquidity of a currency or currency pair. CFDs are complex instruments and come with a high risk of losing money rapidly due to leverage. The vast majority of retail client accounts lose money when trading in CFDs. You should consider whether you can afford to take the high risk of losing your money.
homepaperclipsmartphonelaptop-phonechart-barscross-circle
linkedin facebook pinterest youtube rss twitter instagram facebook-blank rss-blank linkedin-blank pinterest youtube twitter instagram