We’re excited to officially welcome Alan Perez to the LINDEX team as our newest lead analyst and contributor to the LINDEX Show. Starting June 2, 2025, Alan will begin sharing his trade alerts exclusively with VIP Discord members—bringing his experience, market insights, and unique approach to the community.
Alan is a swing and intra-day trader active in the spot FX market, with a particular focus on G10 currencies. His trading style blends both fundamental and technical analysis to form directional bias and manage risk. Alan pays close attention to sentiment shifts, key market dynamics, and bombshell economic news—aiming to identify and ride sustained trends in the market.
He actively trades during the New York, Asia, and London sessions, giving him broad exposure to global price action and market-moving events.
Before becoming a full-time trader, Alan worked at JPMorgan Chase, where he helped clients navigate the financial markets and manage risk in their portfolios. While at the firm, he earned his FINRA SIE, Series 6, and NASAA Series 63 certifications—credentials that reflect his foundational understanding of market structure, compliance, and client advisory.

Alan’s mission as a trader and educator is simple: to provide clarity, accountability, and value for retail traders. He believes in sharing his thought process openly and documenting his performance transparently, both on his YouTube channel and within the LINDEX community.
Whether you're a beginner looking to follow along or a seasoned trader seeking deeper market commentary, Alan’s presence in the VIP Discord will be a valuable addition to your toolkit.
Alan isn’t just a new face—he’s been a long-time supporter of LINDEX. In fact, this past March, he flew out to attend our live trading event with OANDA, connecting with other traders and the A1 team in person. Now, we’re thrilled to have him officially on board—and even more excited that he’ll be sharing free content regularly in both our Telegram and Discord channels for everyone to learn from.

Alan’s trade alerts will be available exclusively to VIP members starting June 2, 2025. If you’re ready to follow along with his strategies and get real-time updates, now’s a great time to join.
Use code READER at checkout to get 10% off your VIP membership
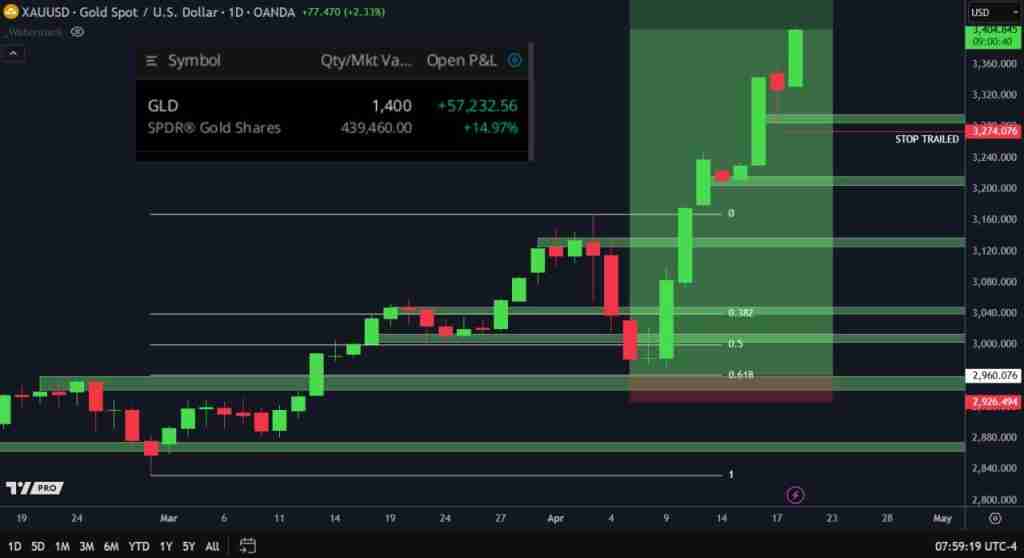
Right now, I’m sitting on over $57,000 in profit from long positions on gold (GLD). That’s not a flex—it’s a testament to what can happen when you stay systematic and follow the fundamentals.
Lately, we’ve seen pressure mounting across several major asset classes:
This isn’t just a blip—it reflects deeper uncertainty in the macro environment. Trade negotiations are stalling. Alliances are being tested. There's concern about what's next for the U.S. economy and its role in the global landscape.
And in the middle of all this, gold is quietly doing its job. When investors get nervous, they often look for safety—and that’s where gold shines. It's long been considered a hedge against both market volatility and monetary instability. When traditional assets falter, gold steps up as both a safe haven and a reliable store of value.
This recent move in gold didn’t catch me off guard.
The EdgeFinder—our data-driven analysis tool—has been highlighting bullish fundamentals for gold since February 6th. For those watching the data, the case has been building for months.
Here’s what we’ve been tracking:
Seasonality data has shown that this time of year tends to be historically bullish for gold.
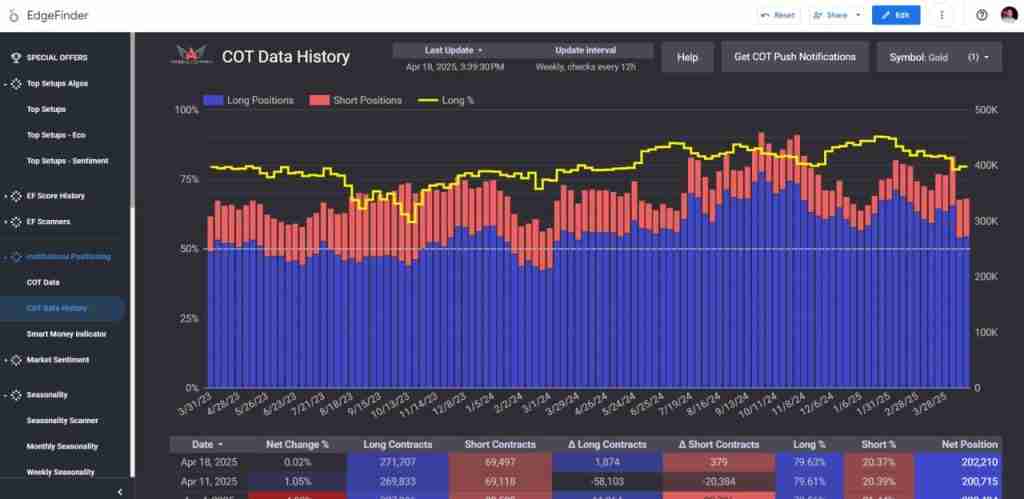
COT (Commitment of Traders) reports continue to show heavy institutional interest—major players aren’t just trading gold, they’re holding it.
Inflation pressures are easing, which gives the Federal Reserve more room to cut rates.
And with oil prices falling, the likelihood of easing monetary policy only grows—an environment that typically supports metals and weakens the dollar.
None of this is guesswork. It’s what the data has been telling us.
One of the biggest advantages I’ve had in this trade isn’t timing or gut feeling—it’s having a systematic way to process information.
The EdgeFinder isn’t about predicting the future. It’s about equipping you with the tools to interpret real-world data: economic reports, sentiment trends, institutional activity, and more.
Too many traders make decisions based on headlines or hype. But when you have something that cuts through the noise and shows you how key data points align, your confidence goes up—and so does your consistency.
That’s what we built the EdgeFinder for: to give traders a real edge based on what actually moves markets.
The goal isn’t to chase headlines or gut feelings. It’s to let the data lead. When you do that, you’re not just reacting—you’re anticipating. Gold is a perfect example of how fundamentals can guide smart, profitable decisions.
So here’s the takeaway:
Stop leaving money on the table.
Start tracking what really matters.
Ignore the data at your own peril.
Everyone Talks About Psychology—But What If That’s Not the Real Problem?
Most traders are taught to focus on trading psychology. Control your emotions. Stay disciplined. Master your mindset.
But after more than eight years of experience, I’ve come to believe that the real solution has nothing to do with psychology—and everything to do with having a system you can trust.
I’ve been in a gold trade for the past seven days. And if I were trading based on emotion or “gut instinct,” I would’ve closed this trade out early—probably multiple times.
The fear of giving back profits or watching the market turn against me would’ve taken over.
But I didn’t close it.
I stayed in because my system told me to stay in.

This wasn’t about confidence. It wasn’t about mindset. It was about trust—trust in a strategy that’s been tested, refined, and consistently delivered results.
The EdgeFinder flagged a bullish setup. Gold pulled back to a key level of support I’ve been watching for a while. And despite all the noise in the news—headlines about tariffs, elections, fear—my system gave me clarity.
I didn’t have to overthink. I just had to follow the process.
Here’s the part no one tells you:
Most traders don’t struggle with psychology—they struggle with not having a process that gives them confidence in the first place.
If you find yourself constantly second-guessing your trades, panicking during pullbacks, or closing too early out of fear, don’t beat yourself up.
You’re not broken—you just need a better plan.
Whether it’s the EdgeFinder or your own strategy, the key is to build something you can rely on. Something that filters out the noise and gives you conviction in the trades you take.
Because once you have that?
The whole psychology thing starts to take care of itself.
If you're ready to build a system that you can trust, now is the time to get started.
Use code READER to get 40% off your purchase of the EdgeFinder. Or, if you want to take it for a spin first, start your 30-day trial today to see how it can help you make more informed, confident trading
decisions.

The EdgeFinder is officially three years old! To celebrate, we’re offering 40% off for a limited time. Use code READER at checkout and take advantage of this special anniversary deal.
How a Long-Term Vision Became a Game-Changer for Thousands of Traders
The EdgeFinder started as a shared vision between LINDEX analysts Frank Cabibi and Nick Syiek. Growing up together, they bonded over music, stocks, and eventually forex trading. They always dreamed of having a tool that could simplify their trading and bring institutional-level analysis to retail traders. In early 2022, that vision started taking shape when they began developing the first version of the EdgeFinder.

“It started out as automating concepts we incorporate into our trading.”
At first, they weren’t sure if the tool would be released publicly. But once the first version was complete, they decided to test the waters. Within one day of announcing the EdgeFinder, the response made it clear—it was something traders needed.
Released: April 2022
Following its release, the EdgeFinder quickly became LINDEX’s #1 software tool. Its success allowed the company to expand, bringing in new team members to improve the software, educate users, and develop new features. In just the first year, the EdgeFinder added game-changing features like:

Today, the EdgeFinder continues to evolve, giving traders the tools they need to make informed decisions faster than ever before.
“We have thousands of people who use the EdgeFinder and it's helping them. Knowing that is really cool!”
We’ve been hard at work making the EdgeFinder even better! Check out these powerful new additions:
And the best part? These features are LIVE NOW and FREE for all EdgeFinder users!
Fundamental analysis can be overwhelming—jumping between multiple sources, analyzing complex data, and trying to make sense of market trends. We built the EdgeFinder to change that.
Since its launch, the EdgeFinder has helped traders simplify their analysis, eliminating the hassle of scattered data and bringing everything into one easy-to-use platform. With tools like economic heatmaps, COT Data, and Top Setups, traders now have everything they need at their fingertips.
To celebrate our three-year anniversary, we’re offering an exclusive 40% discount on the EdgeFinder. Use code READER at checkout and take your trading to the next level.
Claim your discount now: https://lindex.cc/edgefinder
Don’t miss this opportunity to refine your trading strategy with professional-grade tools. Here’s to another year of making smarter trades!
We’re excited to give you full access to the EdgeFinder this week, and we want to make sure you get the most out of it! Whether you’re new to the tool or have been curious about how it works, this free week (March 24 - March 31) is the perfect opportunity to explore its powerful features and see how it can enhance your trading. In this article, we’ll go over what the EdgeFinder does, what it doesn’t do, and some practical tips on how to use it effectively.
Get free access to the EdgeFinder this week only by filling out this form:
The EdgeFinder is designed to help traders make more informed decisions by providing a data-driven approach to market analysis. It pulls together fundamental, sentiment, and technical insights to give each asset a bias score, helping you identify strong bullish or bearish setups. However, it’s important to remember:
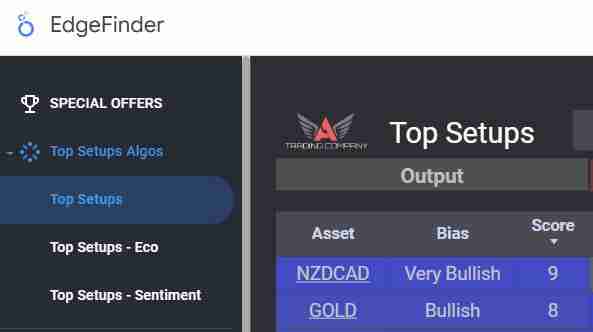
Start by visiting the Top Setups Page, which ranks assets based on their bullish or bearish scores. These rankings are calculated using a mix of fundamental data, sentiment readings, and technical trends.
? Tip: Use filtering options to focus on specific asset types you trade most often, like forex pairs, indices, or commodities.

Once you find a strong setup, compare it with your personal trading strategy. Look at key technical factors like support, resistance, and trend direction. Does the EdgeFinder’s score align with your findings?
? Tip: If the Dow Jones has a "very bullish" rating, check for confluences like a break-and-retest pattern or strong moving averages before making a decision.
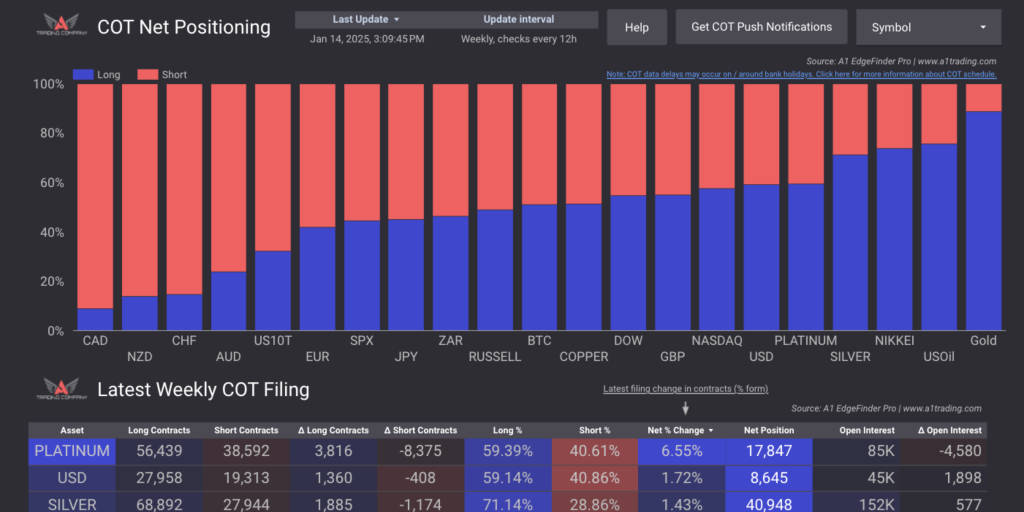
The Institutional Positioning (COT Data) page shows how big money players are trading different assets. Meanwhile, the Retail Sentiment tab reveals how retail traders are positioned. Since retail traders often trade against trends, spotting extreme retail sentiment can be useful for contrarian setups.
? Tip: If institutions are heavily long on gold while retail traders are mostly short, this could indicate a potential bullish opportunity.
The Economic Heatmap provides a visual snapshot of global economic data, helping you see which economies are strengthening or weakening. This can be useful when trading forex pairs or indices.
? Tip: If U.S. economic data is consistently strong compared to expectations, this could reinforce a bullish outlook on the USD.

No matter how strong a setup looks, always use proper risk management. The EdgeFinder helps you find great trade ideas, but you’re still in charge of execution and trade management.
? Tip: Use stop losses, proper position sizing, and avoid overleveraging—especially during high-volatility events.
Want a deeper dive into the EdgeFinder’s features? Check out our full tutorial page here: EdgeFinder Tutorial
The A1 Edgefinder is a fundamental trader's dream tool. This market scanner tool allows you to see a variety of metrics such as COT data and retail sentiment on 37 different currency pairs. This week, our team released some major updates on the A1 Edgefinder that you won't want to miss out on. Let's take a peak at the new look:

The market scanner now has a meter that measures each pairs strength or weakness, making it extremely easy for users to read. This new feature reads from -7 to +7 suggesting whether a pair is a strong sell or a strong buy according to the technical and fundamental metrics that are updated hourly. Right below the meter is a breakdown of all the scores to show which metric carries the most weight for either directional bias. Those scores are tallied up to reach an overall rating on the pair.

Our latest version of the Edgefinder now does commodities like gold and oil. This will allow traders to see what is happening in the commodities market including its strengths and weaknesses relative to the US dollar. These features use the same metrics that are used for currency pairs, which will cause the scanner to react accordingly.
The information you see on each metric is pulled from pools of data every hour to make sure you don't miss changes going on throughout the day. Some metrics are more prompt than others and require special attention like trend readings, retail sentiment and even economic events. Find out about about an interest rate hike, GDP growth, inflation rates, jobs numbers all within an hour of publication. And of course, you won't be needing to fetch all of these data yourself. The Edgefinder will track it and organize it for you 24 times a day.
The historical score chart is a very important addition to the scanner which allows for the user to see how price performed on any given day and the days after compared to its score.

This new feature is really helpful for tracking price action relative to the overall score of the pair. As you can see, once price moved from a +1 to a +2, the scanner indicated a potential buy here. Then, price shot back up to +3, and price moved up with it.
Now until Sunday, take 40% off the A1 Edgefinder when you use the code "READER" at checkout!

There are plenty of things to consider when your looking to choose a forex broker and thousands of options for you to choose from. How do you know which broker is the best fit for you? How can you be sure your broker is legitimate? Here are a list of the top 5 most important things to look for in a broker!
A regulated broker is a broker which is federally monitored and is continually being watched by local governments. Regulation ensures that what you are going to be doing with your money is relatively secure. Without regulation, a broker has free range on how they choose to handle your money. Because of this, you could face more issues trying to deposit or withdrawal money.
Forex brokers make their money through through fixed rate commissions, and/or taking a small bid/ask spread on your trade. Spreads and commissions are similar but spreads can be a bit more dynamic and get wider or smaller based on the markets liquidity. During an off hour, spreads get bigger, during a busy trading hour, they tighten.
When you are checking out a broker be sure to look at the reviews online as well as go through their website. Look for any information about what the broker says about their own spreads and their own commissions. Be competitive here and aim to find good spreads and commissions offered by different brokers.
At the end of the day, it doesn't matter how well you do with your trading account if you can't withdrawal your money. When looking for a broker, you want to have easy access to deposit and withdrawal from your account. Usually, a well regulated broker will have a very smooth process with this as opposed to unregulated brokers.
Another aspect to take into account when choosing a forex broker is what trading platforms and tools they provide. You want to make sure that the platforms that your broker is offering are competitive and align with your preferences. Further, checkout the tools that they offer traders on their website.
Lastly, and perhaps most important, you want to make sure your broker has exceptional customer support. When facing issues regarding your money, you want to feel confident that your broker will provide you will easy access to support. Read reviews and reach out to the customer support of different brokers so you can get a feel for how reliable their customer support is.
Hopefully, reading this article provided you with insight on how to choose a great broker. Checkout a list of our favorite brokers here. Or take our broker quiz here to find the best broker for your needs!

Trend trading is perhaps one of the most commonly used strategies in the forex world. In this article we will be sharing tips on how to determine the end of one forex trend and the potential start of a new one. We will share 3 specific clues that you should be looking for when trend trading that will help improve your entries and exits.
One of the first indicators that a forex trend is ending is a trend line break. Taking a look at the chart below, you can see that there are multiple points throughout this bullish trend where price was supported by the bulls. Throughout this trend, the pair continued to form higher highs and higher lows which proves price to be strong. However, at some point this forex market was ready to start heading south. At this point, circled in the image below, buyers were no longer able to buy this market higher. This was the first time throughout this trend we see a pullback which is not supported by the bulls, showing that the market is likely ready to reverse.

After a trend line break, the first sign that a forex trend is ending, we see a bullish push back that fails to meet higher highs. Throughout the bullish trend price continued to reach higher highs. However, after the initial trend line break we seelower highs beginning to form. Thus, indicating that bears are pushing the market back down.

Finally, we see this level of support, which has held for many weeks get violated and broken beneath. Price eventually dropped below a significant level of support showing that sellers have control of this market.

Looking back, we had 3 major clues that this trend may be headed to the downside. these clues are possible things you can look for to potentially find the start of new trends or the end of a trend. We had a bullish structure and when we saw this structure break it gave us a clear indication that sellers may have some room to run. Our second indication was the forming of a lower high. Finally, there was a break of structural support.With this information about trend trading, we could have identified the series of lower highs and potentially taken a short position.
Hey everybody, this is a breakdown of some of the macro trends around Gold and some of the pressures it is facing from inflation and the Fed's potential rate hikes.
As of 09/26/2021, the Gold Continuous Contract is down -0.75% this week, and -3.79% for the month. Gold is currently caught in a limbo between rising inflation and rate hikes from the Federal Reserve. Inflation is positively correlated with the price of Gold, but there isn't much inflation despite all the liquidity introduced by the Fed.
Bank of America/Merrill Lynch theorizes that Chairmen Powell will announce that QE tapering on November 3rd. The first rate hike to occur in 3Q23 and continue on a quarterly basis. The Fed currently wants inflation as it will juice the economy. If inflation pushes beyond that zone, they may decide to increase rates. Short term inflation is a large concern because of supply line disruptions in the market. If the supply chain cannot meet the demand, then the prices of goods could kick off a bout of inflation that shoots us past the 'Troublesome Zone'.

The key variable is time. If inflation rapidly increases, the fed will move up their 3Q23 plan. If this occurs, the market could react by buying Gold to hedge against a sudden inflationary episode that grew out of the Fed’s control.
The Gold Mining sector is trading below the 10 year Net Asset Valuation, which indicates that the miners themselves are currently undervalued, particularly the Jr. mining stocks. If the price of gold were to swing in favor of the miners, there is more pressure to revert to the mean

After a little digging, I found a Bloomberg Index fund that tracks the price of Gold with incredible accuracy. The following chart shows the top 7 major market indices with the strongest correlation to gold.

SOURCE: World Gold Council
The index with the highest correlation is the Bloomberg Barclays Global Treasury Index, which is pegged to the Global bond market, excluding US bonds and other treasuries. Both foreign bonds and Gold have an inverse relationship with the dollar, but the BBG Global Index is useful for forecasting the overall trend of gold as it offers a less volatile perspective. Due to its high correlation to gold and it’s relatively low volatility, one can chart the overall direction of gold with near 70% correlation. This correlation holds back to 2015.

The benefit of having only a .70 correlation coefficient as opposed to 100% correlation, is that it allows us to see through the "static" of Gold's volatility. The best example is near the end of the chart: GLD moves up near 6.00%, but eventually corrects down to conform with the overall downtrend signal given by the index fund.
Analyst / Writer: Sean Streb
Key points
● The price of Uranium is up 47% in the last 30 days.
● Sprott Physical Uranium Trust initiated a massive ‘at the market’ purchasing initiative for
Uranium
● The trust company believes that demand will vastly outstrip supply and mining
capabilities in the coming years as nations increase their green energy programs in the
form of newer fission reactors
● The price increase in Uranium is highly correlated with Sprott purchases.
State of the Market
The savvy commodities trader may have noticed that the price of Uranium stocks have
skyrocketed to new highs in the last few weeks. Those who were out of the loop were
left scratching their heads and wondering: Why has the price of this radioactive metal
gone nuclear? The answer to this is not very clear. It has certainly made waves as a
“meme investment” on the internet, but the underlying companies don't seem to support
their current value. In the current market, Uranium miners sell their product at a loss.
Hard as it is to believe, it actually costs more money per pound for these firms to mine
Uranium than the market is willing to pay. In order to stay operational, these firms are
required to purchase uranium to meet their committed sales and to maintain a minimum
inventory. The end result is that these firms have been forced to operate at a loss for
years now.
The recent Q2 2021 Management Report for Cameco Corporation (CCJ) published on
June 30th shows that the company’s Average Unit Cost of Sales is $47-$48 per pound
of Uranium. For comparison, the spot price of Uranium on June 30th was around $32
per pound, a $15 to $16 deficit. To cap this all off, COVID19 hit Uranium miners very
hard, forcing them to close several of their mines.

On paper, virtually none of the miners in this market, even the larger firms, look like an attractive buy. In the short term, it is possible for a firm to operate at a loss. In the long term the company, or in this case, the underlying commodity (Uranium) will either correct, or the firm will go out of business. Since Uranium is, and will continue to be a valuable commodity for manufacturing and energy, bankruptcy is unlikely.
But did the price spike up recently?
The answer to this lies with a new player in the game. In comes the Sprott Physical Uranium Trust (TSX: U.UN). On August 17th, this trust company publicly announced an at the market buying initiative for the radioactive metal. Sprott is purchasing an immense amount of Uranium, and advertising this initiative as a step towards a carbon free energy future. Directly from the August 2021 Fact Sheet: as of the 31st, Sprott currently holds $741,169,791 worth of physical Uranium and they are continuing to purchase more.
To add another dimension to this phenomenon: the current demand for Uranium outstrips the supply. Current global demand fluctuates around 200 million pounds of Uranium, when companies are barely mining at all. Given global production is at 125 million pounds, there is a 75 million pound deficit in production. For more information see the image below, courtesy of Sprott's August 2021 Investor Fact Sheet:

Bank of America/Merril Lynch Analysts also made note of a stunning correlation between the Price of Uranium, and the purchasing habits of Sprott Trust. Given the nature of the Uranium marketplace, it is not surprising to see why Sprott has such an influence on the market.

Final Thoughts
A combination of factors make Uranium, and Uranium Miners a compelling trading opportunity and a long term investment. The market currently undervalues the metal as supply isn’t meeting demand at current market prices. Based on this factor alone, the price needs to correct or the companies themselves need to adjust their strategy.
The purchasing habits of entities like Sprott indicate a far thinking view of the future of where carbon free renewable energy plays a larger role in developed nations. As countries move away from fossil fuels, they may incorporate more nuclear energy. Uranium, unlike gold, generates interest in the form of power generation and is frequently used in manufacturing. This means there is opportunity for future growth.
One important thing to follow in the future is the narrative surrounding nuclear power generation. Nuclear power will see wider adoption if it is framed as a green energy alternative to fossil fuels. If this begins to occur in the public forum and media, Nuclear power generation will increase, and by proxy, the demand for Uranium will increase.

